Jupiter price jumps 50% in a month, can it break $0.40 in October?

Jupiter price has gained more than 50% over the past month, but resistance near $0.38–$0.40 stands between its recent recovery and a further October advance.
- Jupiter price gained roughly 51% over the month, trading near $0.37 on Oct. 8.
- Daily price held above the 20-day, 50-day, 100-day and 200-day moving averages.
- Weekly ADX reached 29.43, while daily RSI approached the overbought threshold at 68.88.
- Analyst Nehal identified $0.69 as a conditional breakout target, without setting an October deadline.
MetaMask’s Oct. 8 market data put Jupiter at $0.3673, up approximately 51.37% from $0.2427 a month earlier. The same snapshot recorded a market capitalization near $1.22 billion and roughly $179.69 million in 24-hour trading volume.
TradingView’s Binance JUP/USDT daily chart showed a similar price near $0.3691 later that day, with a session high of $0.3881. The move brought Jupiter close to $0.40 after a recovery from its September lows.
Jupiter approaches the $0.38–$0.40 resistance zone
TradingView’s daily chart shows JUP advancing from a broad base formed through much of 2026. Price repeatedly traded around $0.14–$0.25 before moving above that area in September and extending toward $0.38.
The recent rise has included sharp reversals. CoinGlass’s one-month price trace shows JUP falling toward $0.21 around Sep. 16, climbing toward $0.37 late in September, and then retreating toward $0.31 before its latest rebound.
At approximately $0.3691, Jupiter remained about 5% below the Oct. 8 daily high of $0.3881. A move to $0.40 would represent a further gain of roughly 8.4% from that chart price.
Analyst Nehal identified $0.38–$0.40 as the next resistance zone in an Oct. 8 post. He described Jupiter as having broken above a multi-month accumulation structure and reclaimed its upper trendline.
$JUP looks like it has finally broken out of a multi-month accumulation structure.
— Nehal (@nehalzzzz1) October 8, 2026
Price reclaimed the upper trendline and is now pushing into the next resistance zone around $0.38–$0.40.
If that breakout holds, the next major target is around $0.69 — roughly +82% from here. pic.twitter.com/rc8BK2lsvT
His chart places the recent advance above a narrowing formation that developed over several months. Under that interpretation, holding above the former upper boundary would support the breakout, while a return inside the structure would weaken it.
Globe Of Crypto also published a chart showing Jupiter above a descending resistance line. The account reported a 70% gain on its earlier trading call, a separate measure from JUP’s approximately 51% monthly price increase.
Daily moving averages support the recovery
TradingView’s daily chart placed Jupiter above four simple moving averages: the 20-day at $0.3274, the 50-day at $0.2669, the 100-day at $0.2316 and the 200-day at $0.2087.
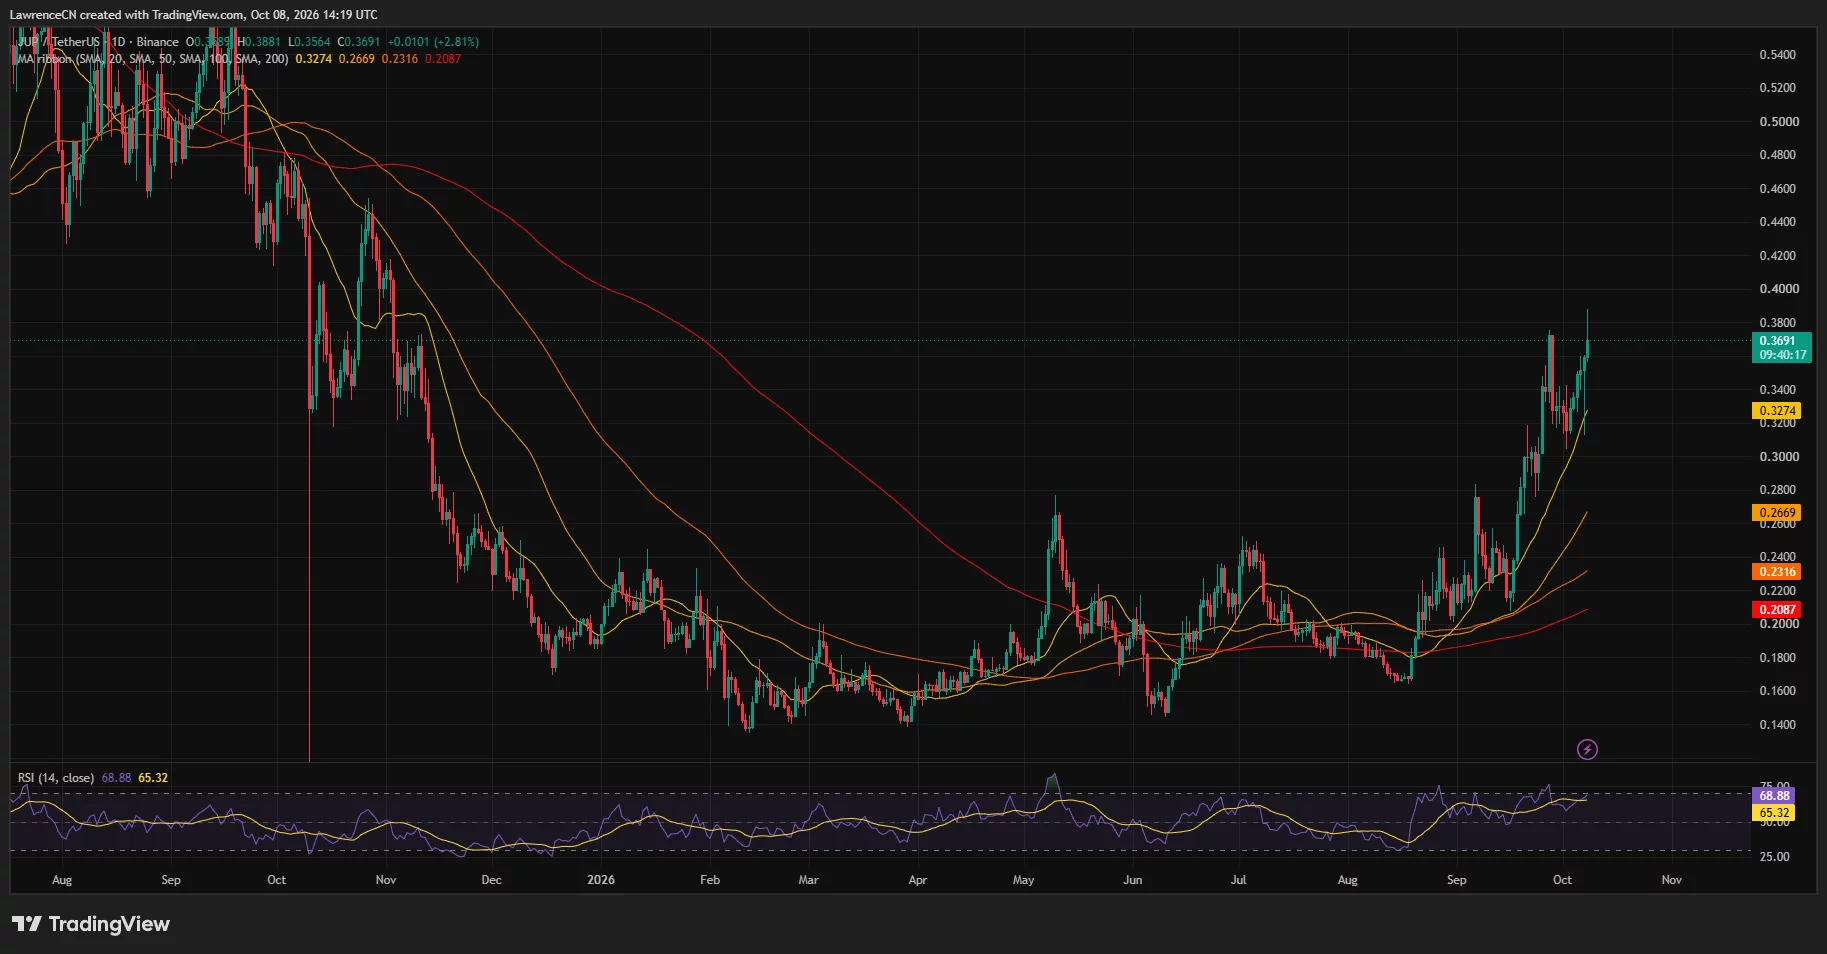
The averages were also ordered from the shortest to the longest, with the 20-day above the 50-day, followed by the 100-day and 200-day. That arrangement is consistent with the upward trend visible in the recent daily price structure.
The closest moving-average reference is $0.3274, around 11.3% below the chart price. It sits within the $0.32–$0.33 area where JUP traded repeatedly during its recent consolidation.
TradingView’s daily relative strength index stood at 68.88, above its displayed average of 65.32. The reading remained below the conventional 70 overbought threshold, although it was close enough to make momentum a key part of the next resistance test.
A further price advance accompanied by a stronger RSI would extend the current momentum. Conversely, a lower RSI reading during another attempt at $0.38–$0.40 would weaken the momentum support for that attempt.
Below the nearest moving average, $0.30 is another visible reference on the daily chart and CoinGlass price trace. A deeper retreat would bring the 50-day average near $0.267 into view.
Weekly momentum strengthens as liquidation bands gather overhead
TradingView’s weekly chart showed JUP near $0.3692, above the upper Bollinger Band at $0.3577. The indicator’s middle band, based on a 20-week simple moving average, stood at $0.2316, while the lower band was $0.1055.
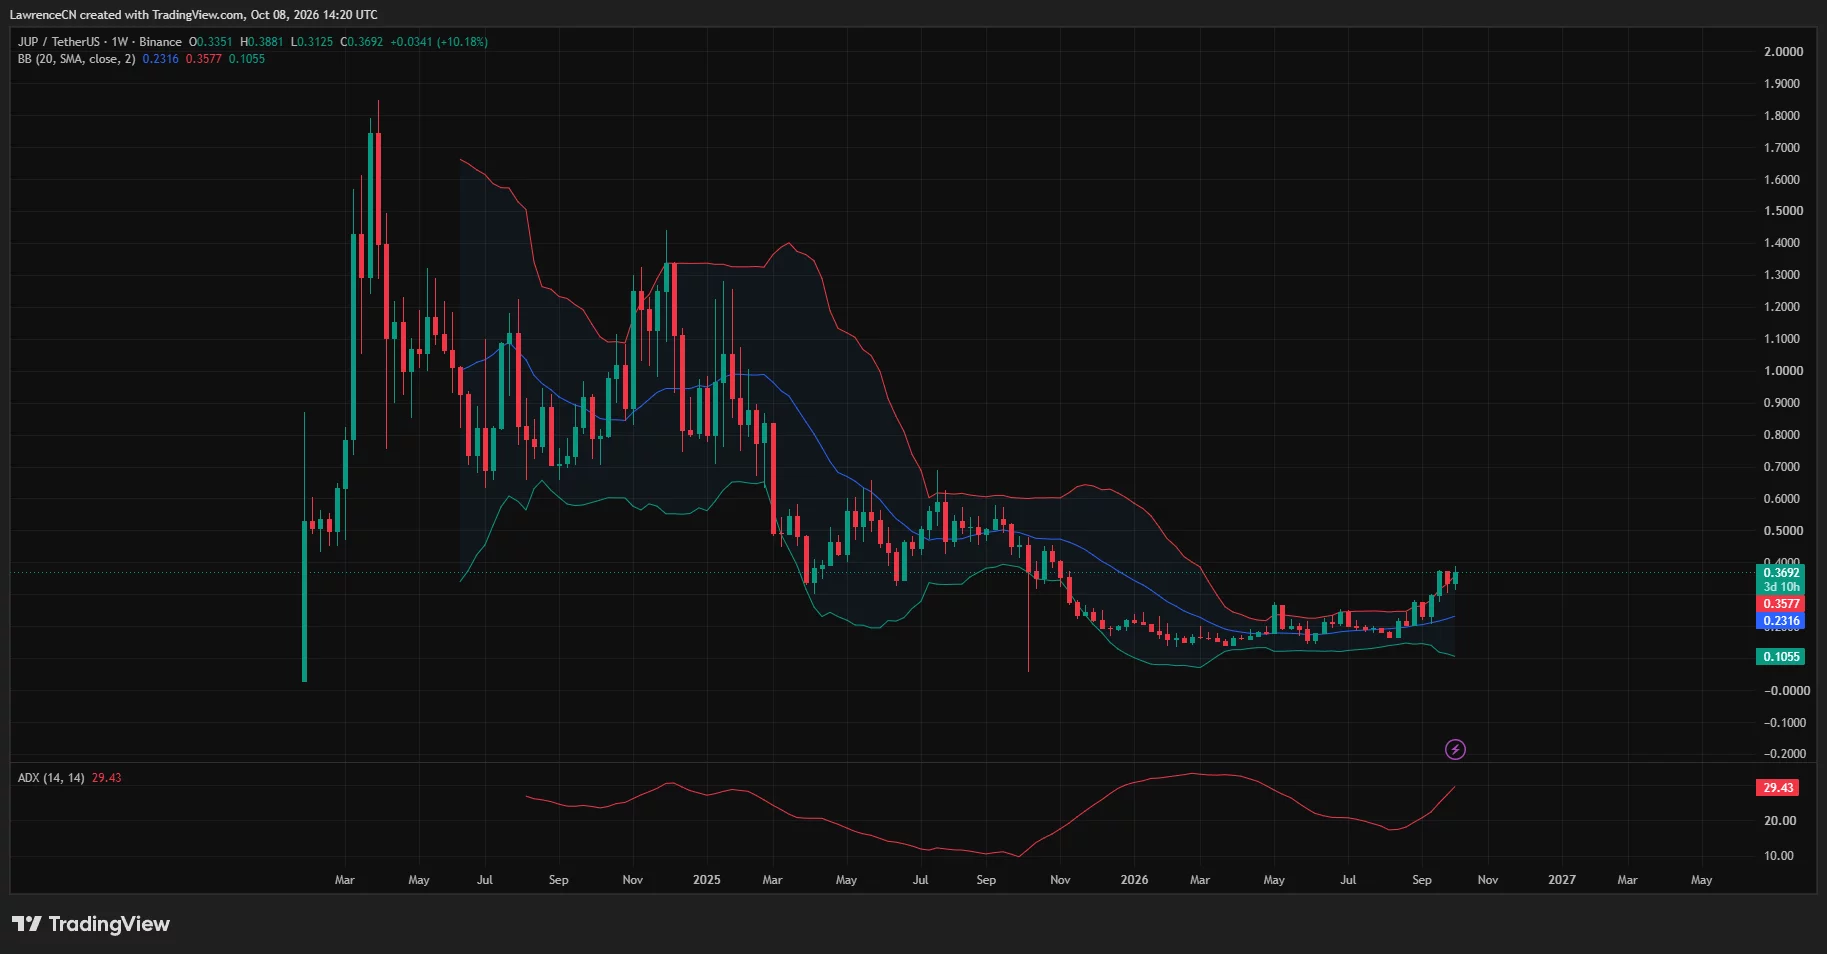
Price above the upper band reflects how far the recent advance has stretched beyond its weekly average. A sustained move there would extend the strength visible in the rally; a retreat below $0.3577 would place Jupiter back inside the bands.
The weekly average directional index reached 29.43 and had risen from its recent trough. An ADX reading above 25 commonly indicates an established trend, although the indicator measures strength rather than direction.
CoinGlass’s one-month liquidation heatmap showed several overhead bands around $0.375–$0.385, with additional concentrations near $0.39–$0.40. Their location overlaps the resistance zone identified by Nehal.
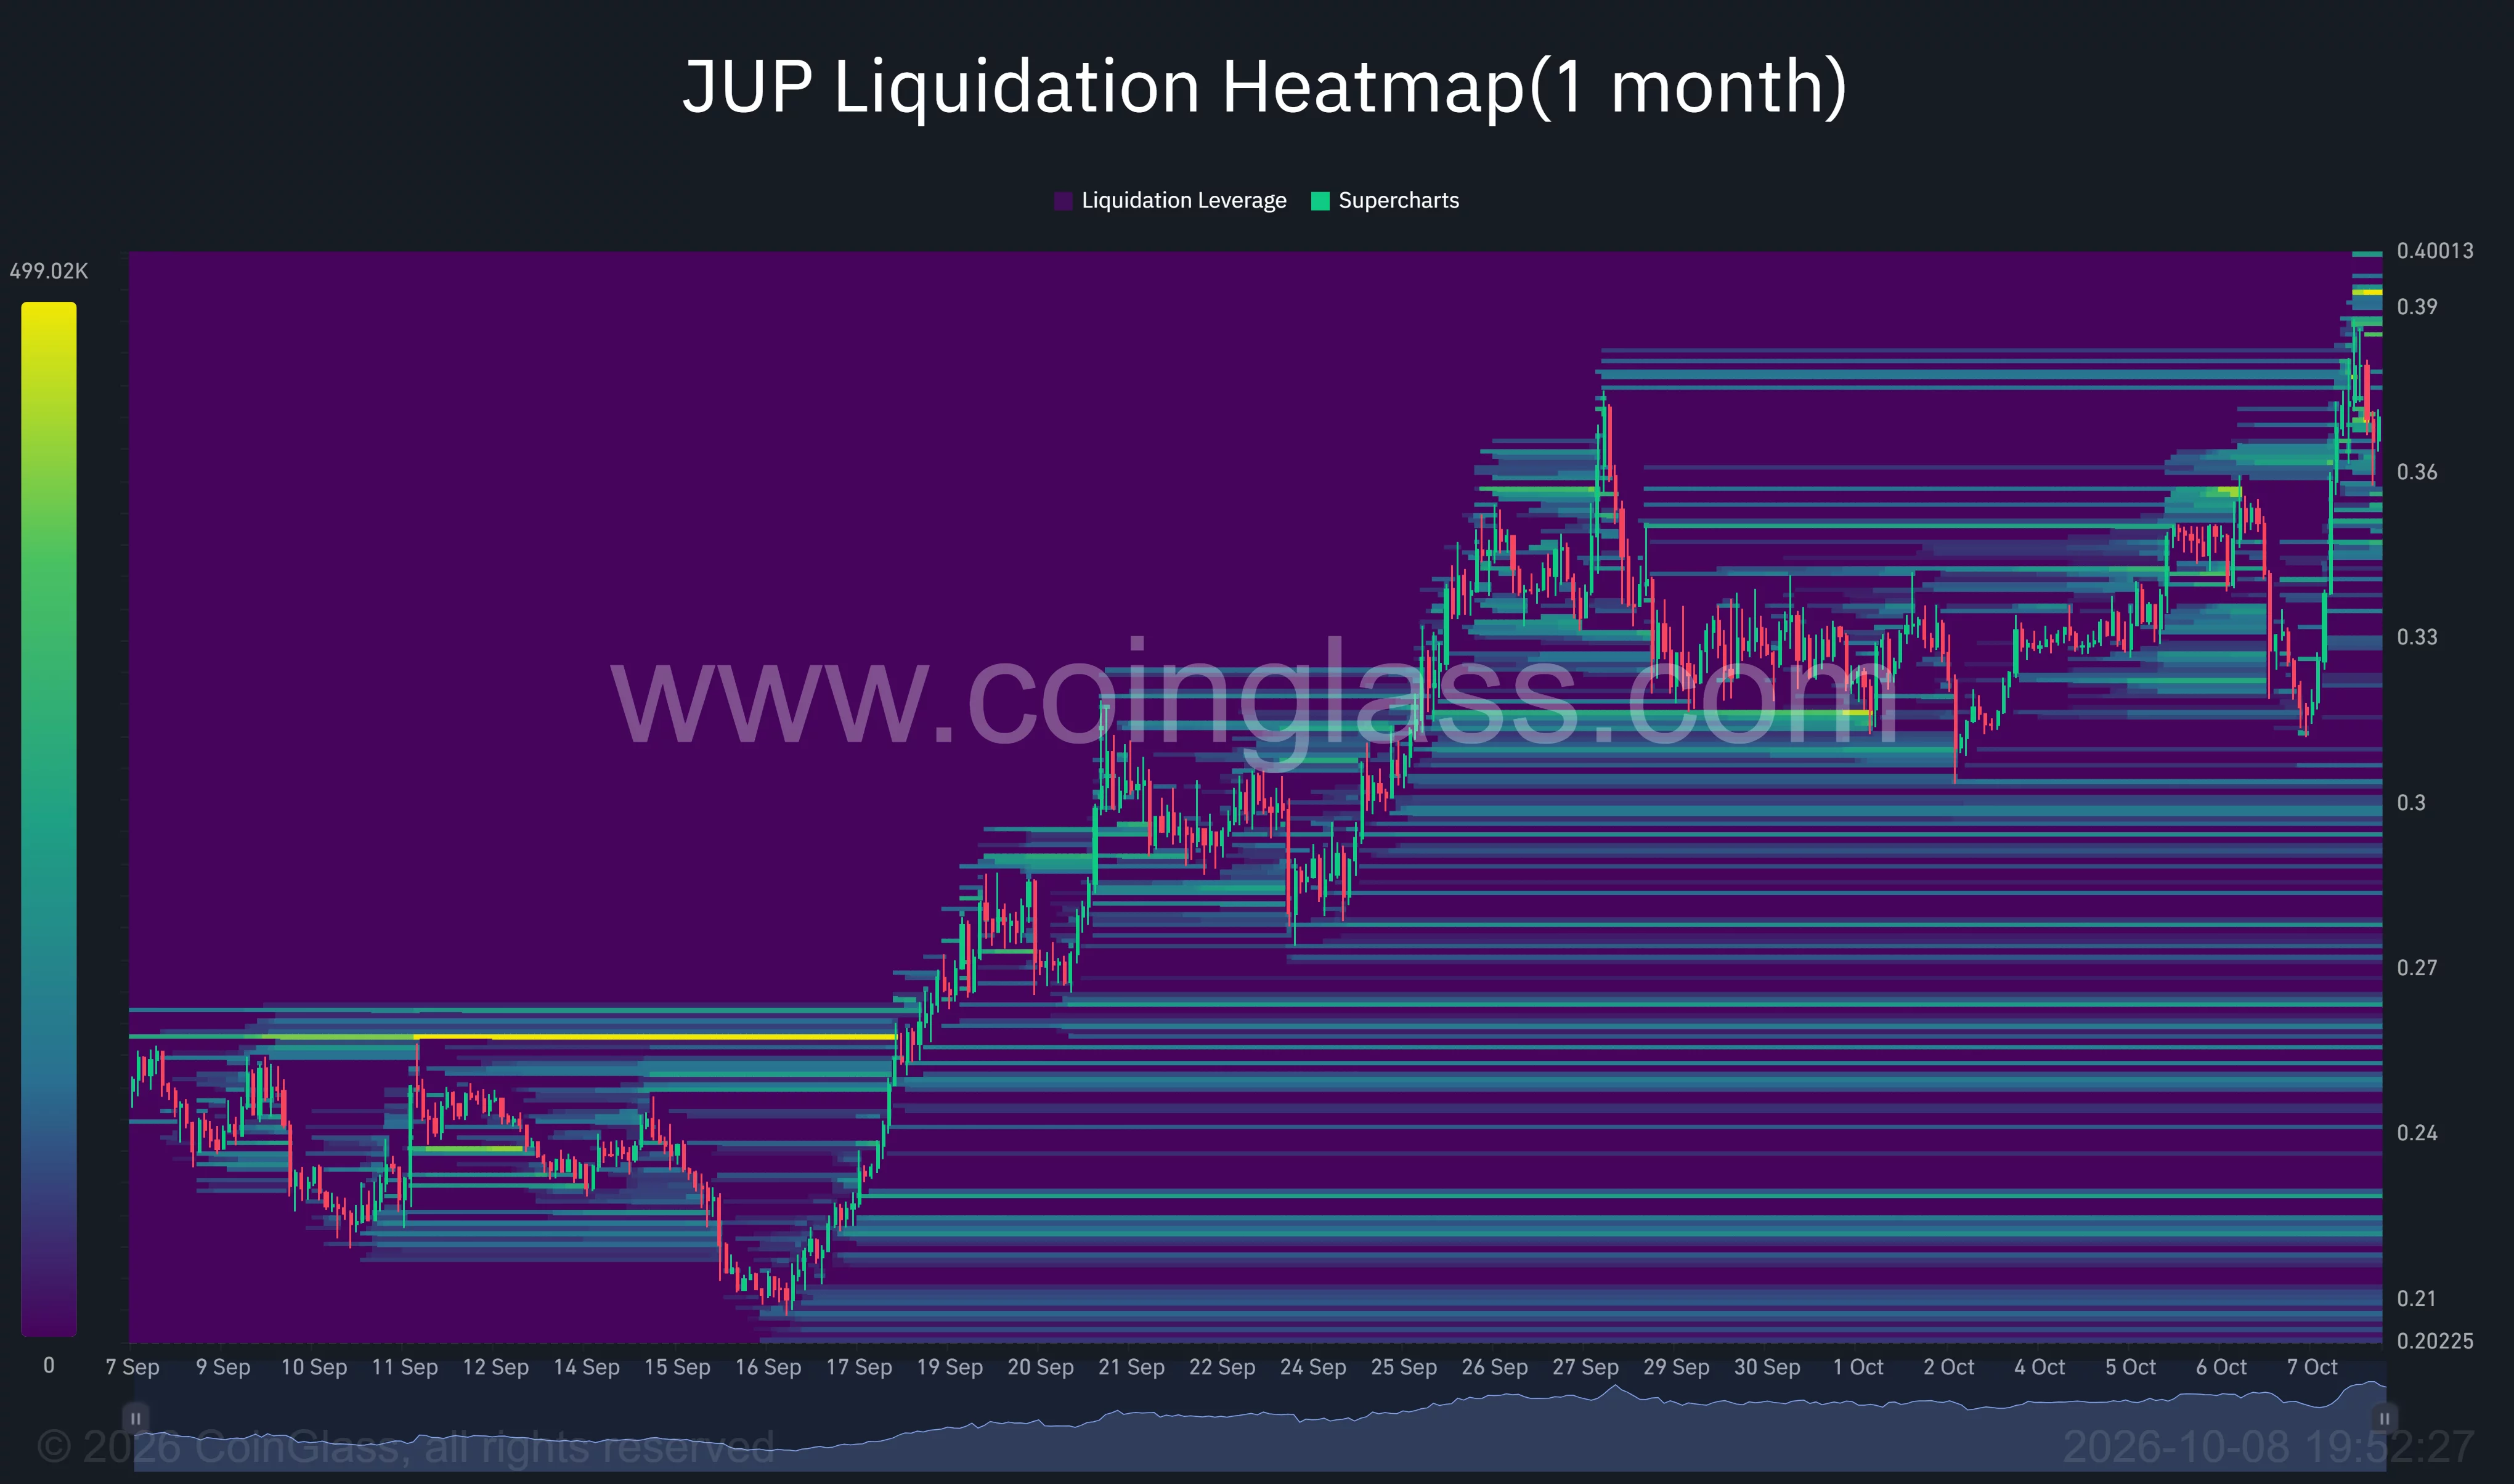
Below price, the heatmap displayed bands around $0.35–$0.36, $0.32–$0.33, and $0.30. Those areas provide nearby references for leveraged positioning if Jupiter reverses from resistance.
The price trace also shows the scale of the latest rebound: JUP recovered from around $0.31 toward $0.39 before pulling back toward $0.37. That swing leaves both the recent high and the rebound’s starting area relevant to October trading.
A $0.40 breakout would strengthen the October upside case
The daily chart places $0.3881 as the immediate high to clear before $0.40. Holding above that zone would strengthen the chart-based case for extending the recovery toward earlier trading areas around $0.42–$0.44.
Nehal’s broader target sits near $0.69, conditional on the breakout holding. His post described that level as roughly 82% above the price used in his analysis, but did not specify when Jupiter might reach it.
At the Oct. 8 TradingView price, $0.69 would require an additional gain of approximately 87%. The nearer October test remains whether JUP can clear $0.38–$0.40 while preserving support around $0.35 and $0.3274.
For U.S. holders taking profits during the rally, the IRS states that selling or exchanging digital assets held as investments can create a capital gain or loss. Assets held for one year or less generally produce a short-term gain or loss upon disposal.
A rejection at resistance followed by a loss of $0.32–$0.33 would weaken Jupiter’s immediate recovery structure. Holding that area through a pullback would preserve the nearest daily support beneath another attempt at $0.40.