XRP price risks further losses as ETFs shed $30.8M in November



XRP price has fallen below $0.90 during November’s cryptocurrency sell-off, putting the token on course for its weakest November in years despite a modest recovery on Sunday.
- XRP price briefly fell to $0.8623 as its November decline reached levels not seen since 2024.
- XRP has lost 31.77% over 30 days and remains nearly 75% below its July 2025 record high.
- U.S. spot XRP ETFs recorded approximately $30.8 million in net withdrawals during November.
- ChartNerd identified a six-year ascending trendline and the $1.47 monthly EMA as key levels.
- XRP price faces immediate resistance at $0.9480, with support near $0.91 and the recent $0.8623 low.
According to crypto.news market data, XRP traded near $0.9239 on November 21 after falling to a 24-hour low of $0.8623. It had lost 9.02% over seven days and 31.77% over the preceding month, with daily trading volume reaching $2.94 billion and market capitalization standing at $58.68 billion.
XRP price breaks below $0.90 as monthly losses mount
The decline briefly took XRP below a price area it had largely maintained since November 2024. Although the token recovered above $0.90, it remained nearly 75% below its July 2025 record high of $3.65.
The latest drop followed an earlier visit to $0.89 on November 14–15. As crypto.news previously reported, XRP had already fallen below $1 amid widespread selling and $19.13 million in weekly withdrawals from U.S. spot XRP exchange-traded funds.
An attempted recovery on November 18 briefly carried the token back to $1.01. However, the gains did not last, and XRP price returned toward $0.90 as Bitcoin plunged toward $55,000 over the weekend.
Historical performance figures point to an unusually difficult November. ReturnsView data showed XRP down roughly 25.5% for the month through November 21, exceeding the 23.6% decline recorded in November 2019. That was its weakest completed November in the dataset dating back to 2013.
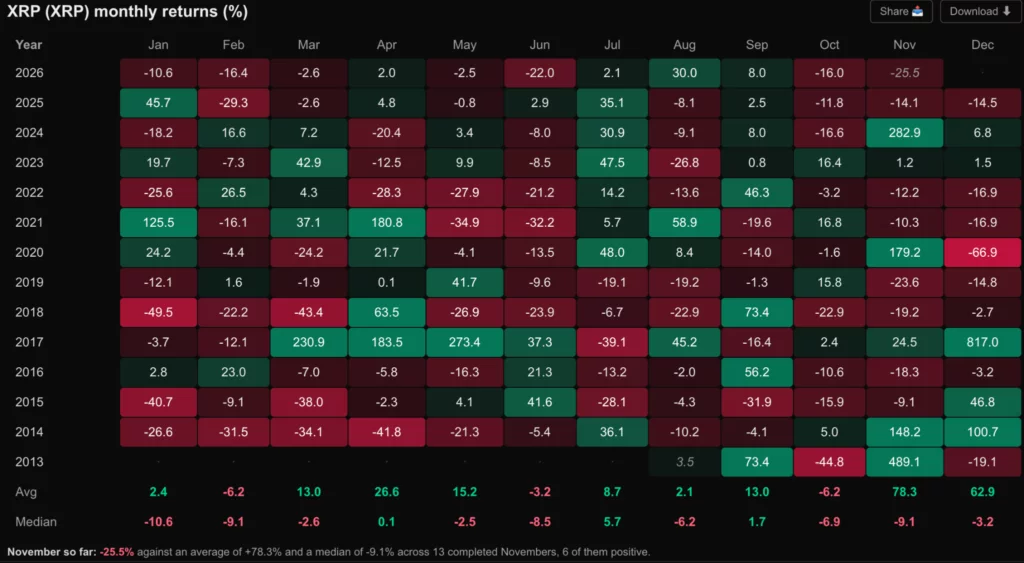
The current monthly candle remains open, with the final percentage dependent on trading during the remaining days of November.
XRP ETFs approach record monthly withdrawals
U.S. spot XRP ETFs have continued losing money through November. According to SoSoValue data cited in November 21 market reports, cumulative withdrawals for the month reached approximately $30.8 million, approaching the $31.2 million negative total recorded in March.
During November 16–20, the funds lost roughly $11.1 million. Tuesday accounted for approximately $6.14 million, while Friday brought another $4.97 million in withdrawals from Bitwise’s XRP ETF. The remaining three sessions recorded no net inflows.
Combined assets across five tracked funds stood near $990 million on November 20, compared with approximately $1.42 billion in October. The decline in fund assets includes changes in XRP’s market price and cannot be attributed entirely to investor withdrawals.
Selling pressure had already affected leveraged traders. Earlier in November, a CryptoQuant analysis identified a $44 million imbalance between XRP long and short liquidations across Binance, Bybit and OKX.
Binance’s XRP futures open interest subsequently declined to approximately $325 million, its lowest level since November 2024, as traders reduced leveraged exposure.
Analysts watch XRP’s six-year ascending support line
Crypto analyst ChartNerd said XRP had remained below its 20-month exponential moving average since December 2025. In a November 22 analysis, he placed the average near $1.47 and identified a six-year ascending trendline as an important support area.
Good Morning $XRP Family 🫡
— 🇬🇧 ChartNerd 📊 (@ChartNerdTA) November 22, 2026
Today's first update takes us back to our 20-month EMA chart, originally shared in September. This moving average is an important macro indicator used alongside other technical measures to assess the broader market trend. $XRP has remained below it… https://t.co/XrbFBowQZT pic.twitter.com/fS6djtMv55
The analyst explained that XRP had encountered significant downside price movements during previous tests of the trendline in 2020 and 2024. He said maintaining monthly closes above the line would be important for preserving its longer-term price structure.
“Reclaiming the 20-month EMA ($1.47 today) would represent a significant macro shift in momentum,” he wrote.
ChartNerd noted that previous market cycles had featured two or three rejections from the same moving average before prices established a bottom.
Meanwhile, analyst Alex Marzell questioned whether XRP’s loss of major Fibonacci retracement levels could eventually create a buying opportunity. His November 22 assessment described the sell-off as aggressive but stopped short of identifying a confirmed reversal.
“I’m watching for a reversal confirmation before considering an entry,” Marzell wrote, warning against buying simply because prices had fallen.
Another analyst, Crypto Patel, identified the $0.75–$0.42 region as a potential longer-term support area. He placed a monthly market-structure recovery level at $1.697 and identified $3.28 as a major resistance barrier.
His more optimistic $10–$20 projection was conditional on XRP defending its ascending trendline and breaking above $3.28.
$XRP Price Prediction: Is $20 the Next Long-Term Target?#XRP Dropped Below $0.90 & Now approaching a critical long-term decision zone.
— Crypto Patel (@CryptoPatel) November 22, 2026
Here's what the monthly chart reveals:
➡️ $0.75–$0.42: Major support & long-term accumulation zone.
➡️ $1.697: Monthly CHoCH, reclaiming this… pic.twitter.com/4uGAOOzihM
XRP price prediction points to $0.86 support
The November 22 TradingView daily chart placed XRP near $0.9334, showing a modest recovery from the previous day’s reported price.
However, XRP remained below its nine-day moving average at $0.9480 and its 21-day moving average at $1.0613. The shorter average was still beneath the longer one, indicating that the recent decline had not yet reversed.
The Relative Strength Index stood at 29.62, below the commonly watched oversold threshold of 30. Although this reading can accompany short-term recoveries, it does not establish that selling has ended.
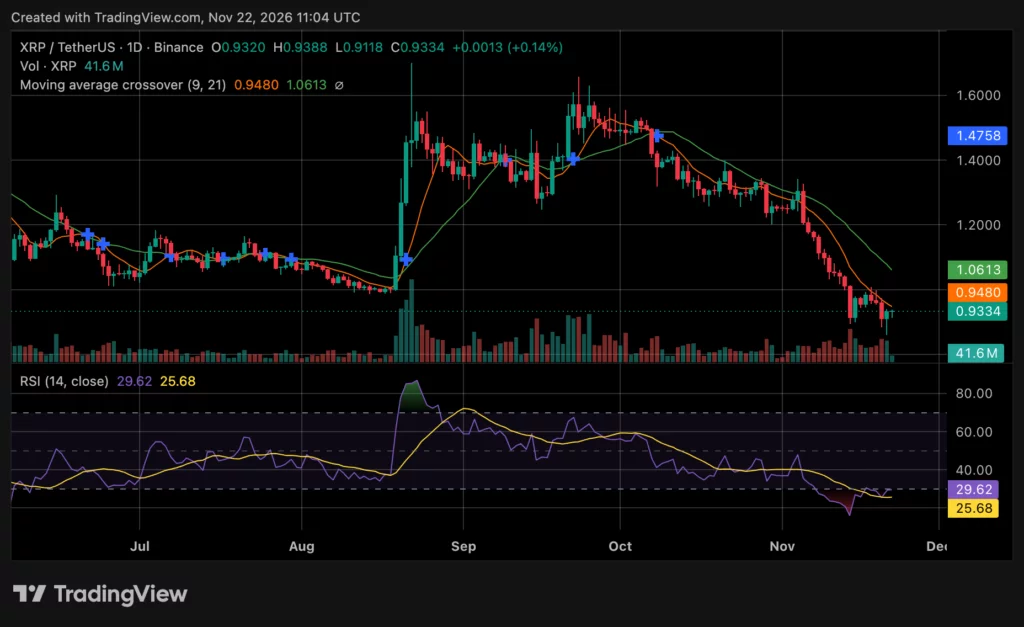
Immediate resistance sits near $0.9480. A sustained recovery above that level could bring $1 back into focus, followed by the 21-day moving average around $1.0613.
On the downside, $0.91 remains the first support area, with the recent $0.8623 low providing another reference. Earlier XRP price analysis identified $0.80 as a deeper downside level if the cryptocurrency failed to maintain its recent trading range.