XRP price dips as futures activity hits 8-month high


XRP has fallen 8.28% over the past seven days to $1.38, while declining futures activity and bearish technical indicators have raised questions about whether the cryptocurrency can defend its $1.30 support level.
- XRP traded at $1.38 after falling 2.48% daily and 8.28% over seven days, CoinGecko reported.
- Binance XRP futures recorded $511 million average open interest, an eight-month high, CryptoQuant analyst reported.
- Daily open interest reached $467 million, below its monthly average, with its Z-score near -0.99.
- Analyst EGRAG cited XRP quarterly election-year returns across 2014, 2018, and 2022 as mixed results.
- Technical indicators showed XRP’s RSI below 50 and MACD below its signal line during trading.
CoinGecko market data showed XRP trading at $1.38 at press time, down 2.48% over 24 hours, with daily trading volume reaching $2.15 billion. Its market capitalization stood at approximately $86.8 billion, supported by a circulating supply of roughly 63 billion XRP. A later October 13 market snapshot placed the token closer to $1.36, confirming continued price fluctuations.
XRP price faces selling pressure near $1.30 support
Following its recent decline, XRP has struggled to maintain gains above the $1.45–$1.50 region. The supplied daily chart showed the cryptocurrency trading near $1.3766, following a recovery from lows recorded earlier in the year. Its longer-term price structure remained under pressure after retreating from levels above $2.20 in late 2025.
On the daily chart, immediate support sits around $1.30, with another potential buying area near $1.20. Resistance is concentrated between $1.45 and $1.50, while a sustained move above $1.60 would strengthen the recovery scenario. Previous analysis of XRP’s $1.30 support level identified the area as a zone where buyers had repeatedly entered the market.
The Relative Strength Index stood at 43.28 in the supplied technical reading, below its moving average of 49.61. With the indicator remaining beneath the neutral 50 level, the chart showed weaker buying momentum. However, the RSI remained above 30, meaning XRP had not entered oversold territory under the conventional interpretation of the indicator.
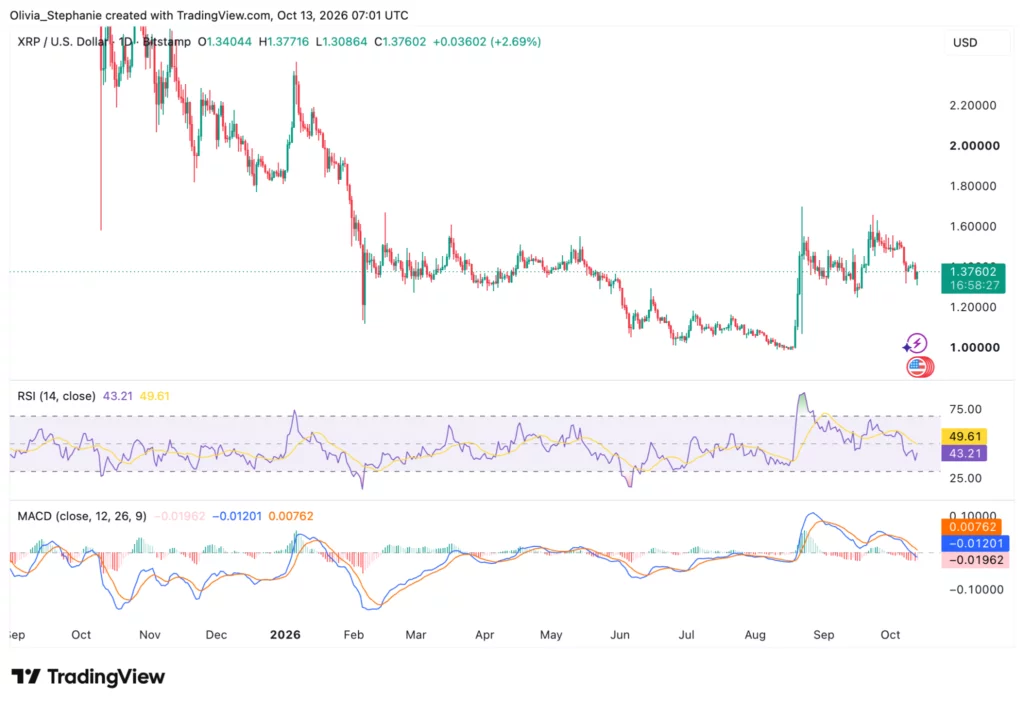
Meanwhile, the Moving Average Convergence Divergence indicator showed its main line at -0.01196, below the signal line at 0.00763. The histogram registered -0.01959, confirming negative momentum at the time of the chart. A move above $1.50 would improve the short-term technical structure, while losing $1.30 could expose XRP to another test of lower support.
XRP futures open interest reaches eight-month average high
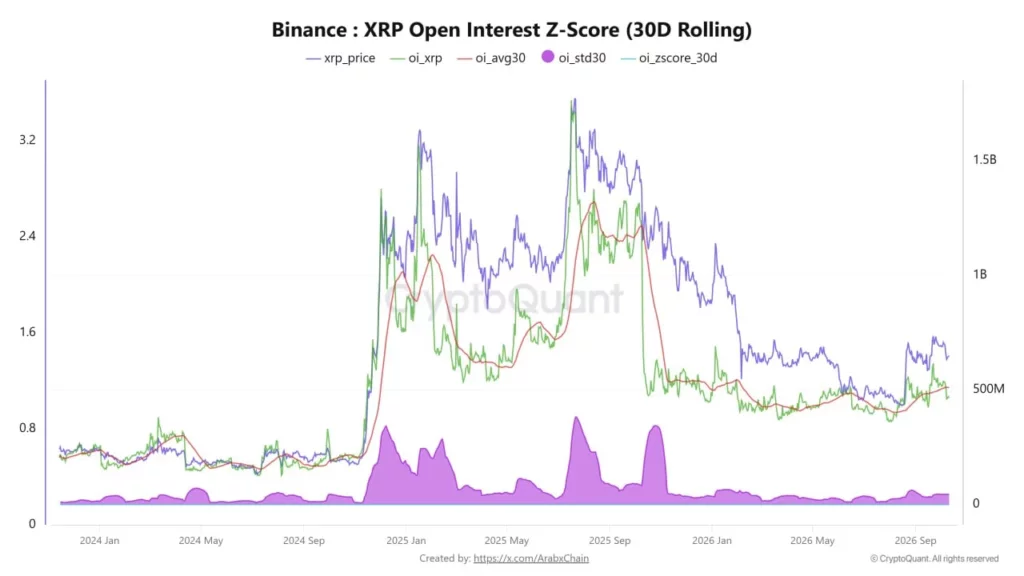
Despite the price weakness, Binance futures data showed that average XRP open interest over the past 30 days had reached its highest level in eight months. CryptoQuant analyst Arab Chain reported that the 30-day average stood near $511 million, indicating increased derivatives activity during the preceding month.
The latest daily reading presented a different picture. Open interest had declined to approximately $467 million while XRP traded near $1.41 at the time of the analyst’s observation. The figure was $44 million below the monthly average, suggesting that outstanding futures positions had decreased from their recent elevated levels.
Arab Chain explained that rising open interest does not necessarily indicate growing bullish expectations because the metric includes both long and short positions. The analyst noted that the latest reduction could reflect existing positions being closed or slower demand for opening new leveraged trades.
The 30-day rolling XRP Open Interest Z-Score reinforced the difference between current activity and the monthly average. At approximately -0.99, the indicator showed that open interest was nearly one standard deviation below its recent mean.
Earlier analysis of XRP futures open interest and price volatility examined the relationship between falling derivatives positions and changing market conditions. The March report documented a 70% decline in aggregate open interest from October 2025 to March 2026, providing historical context for the latest derivatives readings.
Analyst sees mixed XRP returns after U.S. midterm elections
With the U.S. midterm elections approaching in November, crypto analyst EGRAG CRYPTO has examined XRP’s historical performance during previous election years. The analyst shared quarterly return figures from 2014, 2018 and 2022, identifying substantial differences between the three periods.
#XRP – MIDTERM ELECTIONS: HISTORY TELLS A DIFFERENT STORY! 👀🔥
— EGRAG CRYPTO (@egragcrypto) October 12, 2026
After analyzing #BTC, I turned to #XRP's performance during U.S. MIDTERM ELECTION YEARS!
Q4 MIDTERM RETURNS:
🟢 2014: +423.1% 🚀
🔴 2018: −39.4%
🔴 2022: −29.3%
NOW THE INTERESTING PART! 👀
What happened in Q1 &… pic.twitter.com/ZxxHIg6KOq
According to his analysis, XRP gained 423.1% during the fourth quarter of 2014 but declined 39.4% in the same quarter of 2018 and 29.3% in 2022. The figures represent historical returns selected by the analyst and do not establish a reliable pattern for the upcoming election period.
Looking at the first two quarters following those midterm elections, EGRAG calculated an average XRP return of -6.8% in Q1 and a gain of 20.1% in Q2. His combined compounded calculation produced an average return near zero across the periods examined.
For comparison, the analyst estimated Bitcoin’s average post-midterm performance at 19.7% in Q1 and 59.7% in Q2, producing a compounded first-half average of approximately 86.5%. EGRAG suggested Bitcoin could lead a market recovery before investors turn toward XRP and other cryptocurrencies, although he emphasized that the dataset contains only three historical cycles.
In a separate October 13 post, EGRAG outlined a more aggressive long-term XRP price scenario for 2027. His projections included $6.40 as an initial expansion target, $10.38 as a fractal-based objective and a possible macroeconomic cycle peak between $20 and $27.
The targets remain speculative chart projections and are not supported by confirmed future buying demand or announced institutional transactions. At $1.38, a move to $6.40 would require a gain of approximately 364%, while reaching $10.38 would require a rise of roughly 652%.
Can XRP price recover toward $2?
Another crypto market analyst, Carolina, has identified $1.39–$1.32 as a support area that could determine XRP’s next directional move. In her October 12 assessment, she said her preferred bullish scenario would remain valid as long as the previous Thursday’s low held.
$XRP at a critical juncture.
— Carolina (@Carolinatcwnl) October 12, 2026
As long as Thursday's low holds, the "white scenario" remains valid.
Key levels to hold:
$1.39 – $1.32
Targets:
$1.70 → $2.00+
Market structure remains intact; awaiting a breakout.#XRP #Ripple #Crypto pic.twitter.com/PMrvqhgYRc
Carolina identified $1.70 as an initial recovery objective, followed by $2.00 or higher if the price structure remained intact. The targets depend on XRP maintaining support and recording a confirmed upward breakout, neither of which was established by the latest market reading.
At the same time, CryptoQuant has published a separate analysis of XRP exchange reserves and withdrawal activity. The report examines differences between exchange balances and the share of transactions involving withdrawals, although its detailed numerical findings could not be independently retrieved from the public page.
For the immediate trading outlook, the supplied daily chart places the first resistance area at $1.45–$1.50. XRP would need to recover above that range before testing $1.60, with Carolina’s $1.70 and $2.00 projections representing subsequent conditional targets.
On the downside, the chart identifies $1.30 as the nearest major support, followed by $1.20 if selling continues. The latest RSI and MACD readings remain below their respective bullish thresholds, while CryptoQuant’s $467 million daily open interest figure shows a decline from the eight-month-high monthly average.