Solana price tests upper Bollinger Band above $105


Solana price rose more than 4% on Sep. 18, reclaiming $105 in a derivatives-driven rebound, and a move above short-term resistance strengthened bullish momentum.
- Solana price traded near $105.89 after rising 4.18% during the daily session.
- SOL moved above its 20-day average, while the daily ADX remained strong at 41.91.
- 4-hour RSI reached 71.37, placing the token in overbought territory.
- Liquidation clusters near $107–$108 could attract price, while $103–$105 forms initial support.
Solana price action today
According to data from crypto.news, Solana (SOL) price climbed from a daily opening price of $101.63 to about $105.89 at the time of writing, representing a gain of 4.18%. The token traded between an intraday low of $100.90 and a high of $106.67.
The recovery extended a rebound from below $97 earlier in the week and returned SOL to the upper end of its September trading range. Buyers defended the $100 psychological level before pushing the price through the $103–$105 area.
SOL also gained alongside a wider crypto-market rebound following the Federal Reserve’s latest policy decision. Short liquidations added buying pressure as traders who had positioned for further losses were forced to close bearish positions.
The advance offered some relief after regulatory uncertainty weighed on digital assets following the U.S. Senate’s failure to advance the CLARITY Act. However, the charts suggest SOL’s next move will depend on whether buyers can hold the breakout rather than the size of the initial rebound alone.
Technical indicators favor buyers above $100
Solana’s daily chart shows the price trading above all four major moving averages. The 20-day simple moving average stood at $101.87, providing the nearest dynamic support.
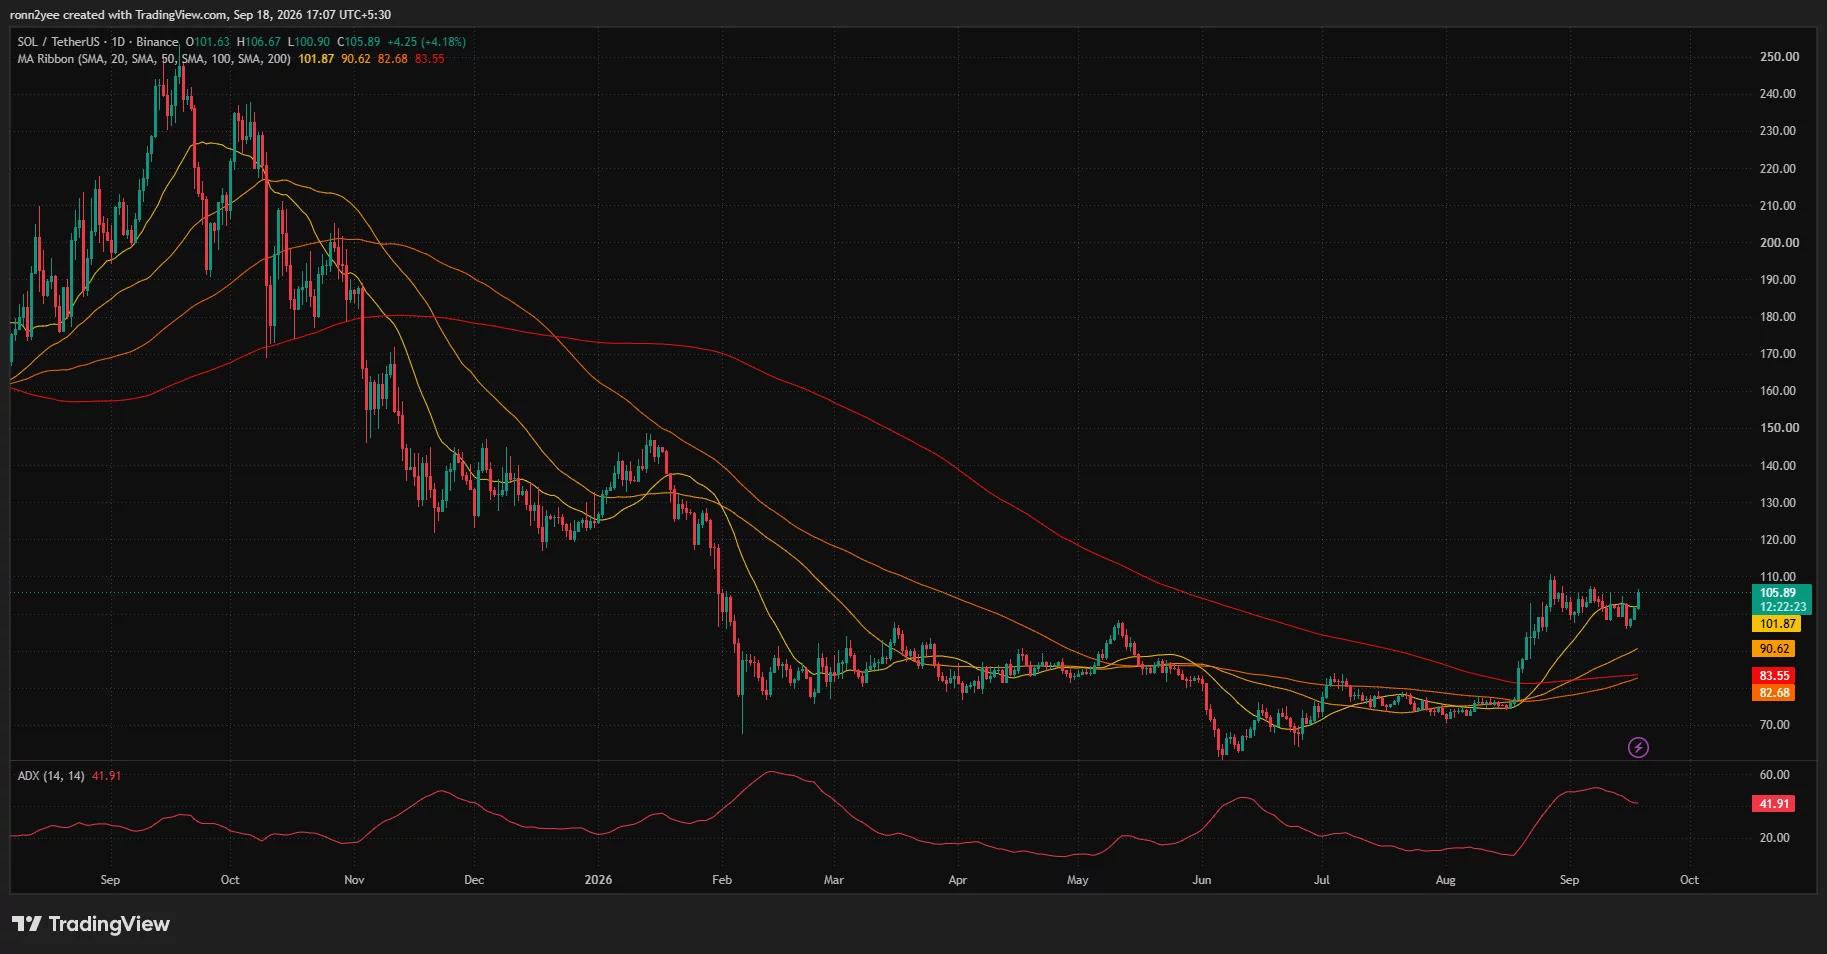
Longer-term averages remained farther below the market. The 50-day SMA was near $90.62, while the 100-day and 200-day averages were clustered around $83.55 and $82.68, respectively.
SOL’s position above those averages keeps its broader recovery structure intact. The 20-day line has also turned upward, while the shorter averages remain above the longer-term indicators.
The average directional index registered 41.91 on the daily chart. An ADX reading above 25 typically points to a strong trend, although it does not determine whether that trend will move higher or lower. In SOL’s case, the price structure and moving-average alignment currently favor buyers.
The 4-hour chart presents a more cautious short-term picture. SOL traded above the Bollinger Bands’ middle line at $100.09 and briefly exceeded the upper band near $105.47. A move outside the upper band can signal strong momentum, but it may also precede a pause as volatility expands.
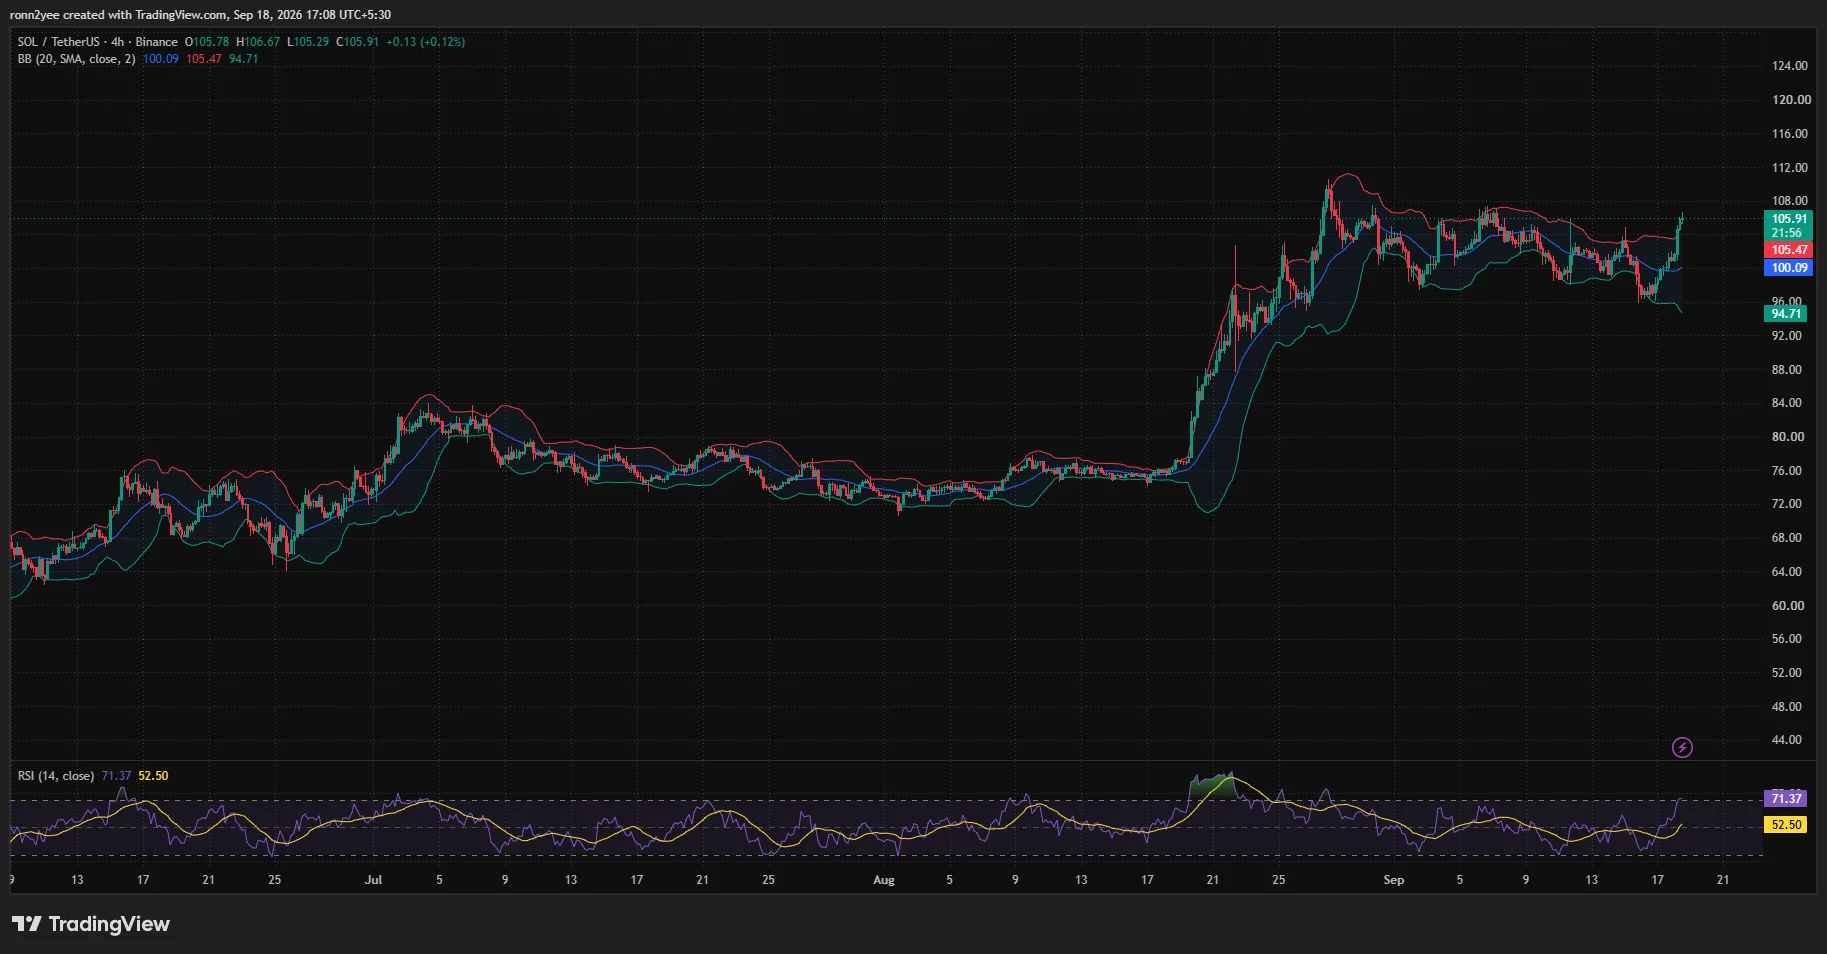
4-hour relative strength index reached 71.37, above the commonly watched overbought threshold of 70. The reading does not confirm an immediate reversal, though it shows that the rally has become stretched and could face profit-taking.
SOL liquidation map points to $107–$108
CoinGlass’ 24-hour liquidation heatmap shows SOL advancing from below $100 to above $105 as the price moved through several leverage clusters.
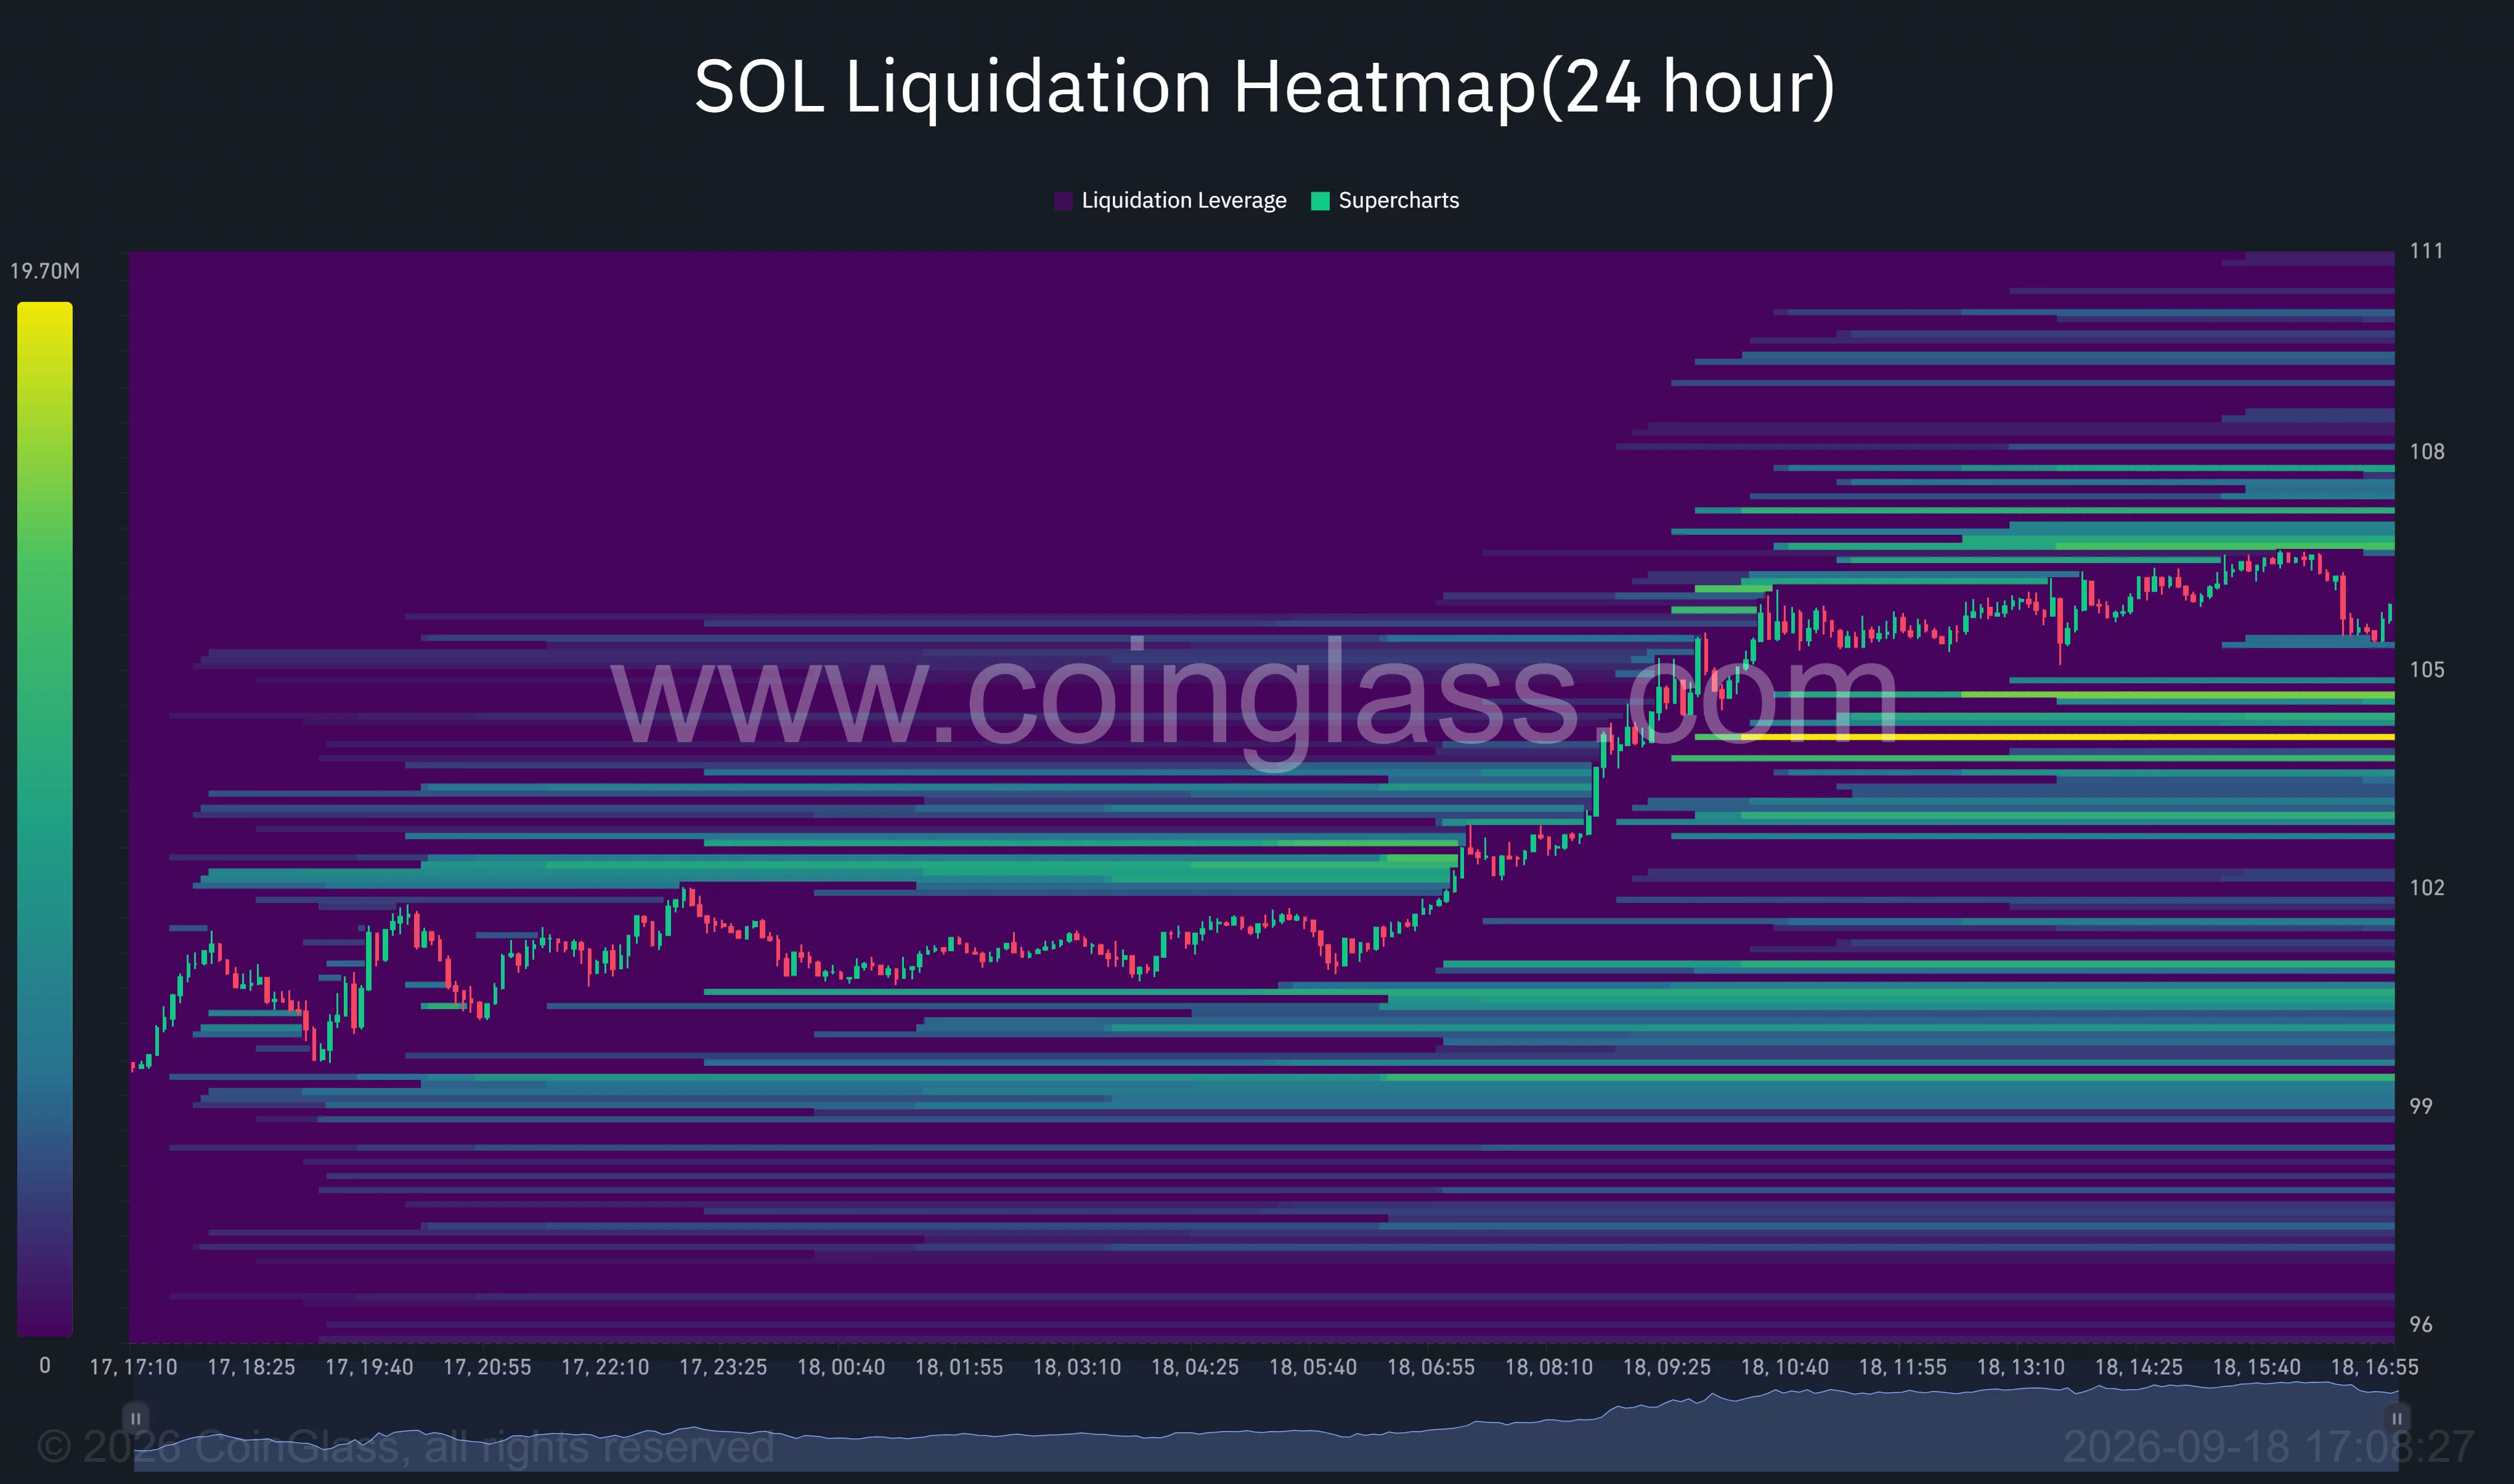
The nearest concentration of overhead liquidity appears between approximately $106.50 and $108. Bright bands in that region indicate leveraged positions that could be liquidated if SOL continues higher. Price often moves toward concentrated liquidity, although a heatmap cannot predict whether the market will reach those levels.
A break above $106.67, the session high, could expose $107–$108 as the next immediate target. Clearing that range would place the late-August and early-September highs around $110–$112 back in focus.
Liquidity is also building below the current price. The strongest nearby bands appear between $103 and $105, followed by clusters near $100–$101. The structure makes $103 the first area buyers need to defend if the rally loses momentum.
A drop below $100 would weaken the breakout and could send SOL toward the 4-hour lower Bollinger Band near $94.71. On the daily chart, the 50-day average near $90.62 would form the next broader support zone.
Analysts see $100 as a major support floor
Crypto analyst Ali Martinez said on-chain data showed more than 40 million SOL had traded around $100, creating what he described as a major support floor.
SOLANA READY TO GO PARABOLIC
— Ali Charts (@alicharts) September 18, 2026
On-chain data shows Solana has built a major support floor around $100, with more than 40 million SOL traded.
But the weekly chart may be even more bullish.
Zooming out, $SOL appears to have spent the last few years building a massive… https://t.co/Z0x09V7DSA pic.twitter.com/8TT6ChDEDO
Martinez also pointed to a possible cup-and-handle pattern on Solana’s weekly chart, with a neckline near $360. He said a confirmed breakout above that level could open a longer-term path toward $1,300.
The projection remains far above SOL’s current market price and depends on a confirmed weekly breakout that has not occurred. SOL would first need to clear several closer resistance areas, including $108, $112 and $130.
Pseudonymous analyst Scient offered a nearer-term target, saying SOL could extend toward $130 following the daily support-and-resistance flip. The trader said he planned to reduce half of his spot position around that level and look for a possible re-entry near $90.
Both outlooks treat the $100 area as a key dividing line. The current daily chart supports that view because SOL’s 20-day average sits just above $101, while the liquidation map shows several leveraged clusters around the same region.
What comes next for Solana price
Solana’s short-term setup favors buyers while the token holds above $103 and the 20-day average near $101.87. A decisive close above $106.67 could allow SOL to target the $107–$108 liquidation zone, followed by the previous local highs near $110–$112.
Momentum risk has increased, however, because the 4-hour RSI has entered overbought territory and price has moved above the upper Bollinger Band. Failure to hold $103 could trigger a retest of $100, where both technical support and a large on-chain cost basis are concentrated.
For U.S. investors, the Federal Reserve’s policy outlook and congressional progress on crypto market-structure legislation remain external risks. SOL’s technical breakout may hold while risk appetite remains firm, but renewed pressure across U.S. equities and crypto derivatives could expose the liquidity clusters below $100.