Solana price forms bullish setup above $96 support


Solana price traded near $97.50 on Aug. 26 after gaining about 14% over seven days, as improving risk appetite, short liquidations, ETF inflows, and network developments pushed SOL above several resistance levels.
- Solana price climbed from $85.37 on Aug. 20 to a weekly high above $102.
- Price remains below the $100 resistance while the daily RSI stands at an overbought 79.
- 4-hour buying pressure remains positive, with CMF at 0.14.
- Analysts are divided between a rally toward $120 and a correction below $92
Solana price breaks out but stalls below $100
Solana (SOL) price rose from an Aug. 20 opening price of $85.37 to an intraday high above $102.59 on Aug. 25. The move represented an increase of more than 20% at its peak, although profit-taking later pulled SOL back toward $97.50.
SOL was still up about 14% over the seven-day period at the time of writing. The rally allowed the token to break above the $87.50 and $93.75 Murrey Math levels, both of which had previously acted as important resistance zones.
The daily chart shows that the price briefly crossed the $100 “ultimate resistance” level before sellers forced it lower. SOL also tested the $102–$103 area twice, but buyers were unable to secure a daily close above that range.
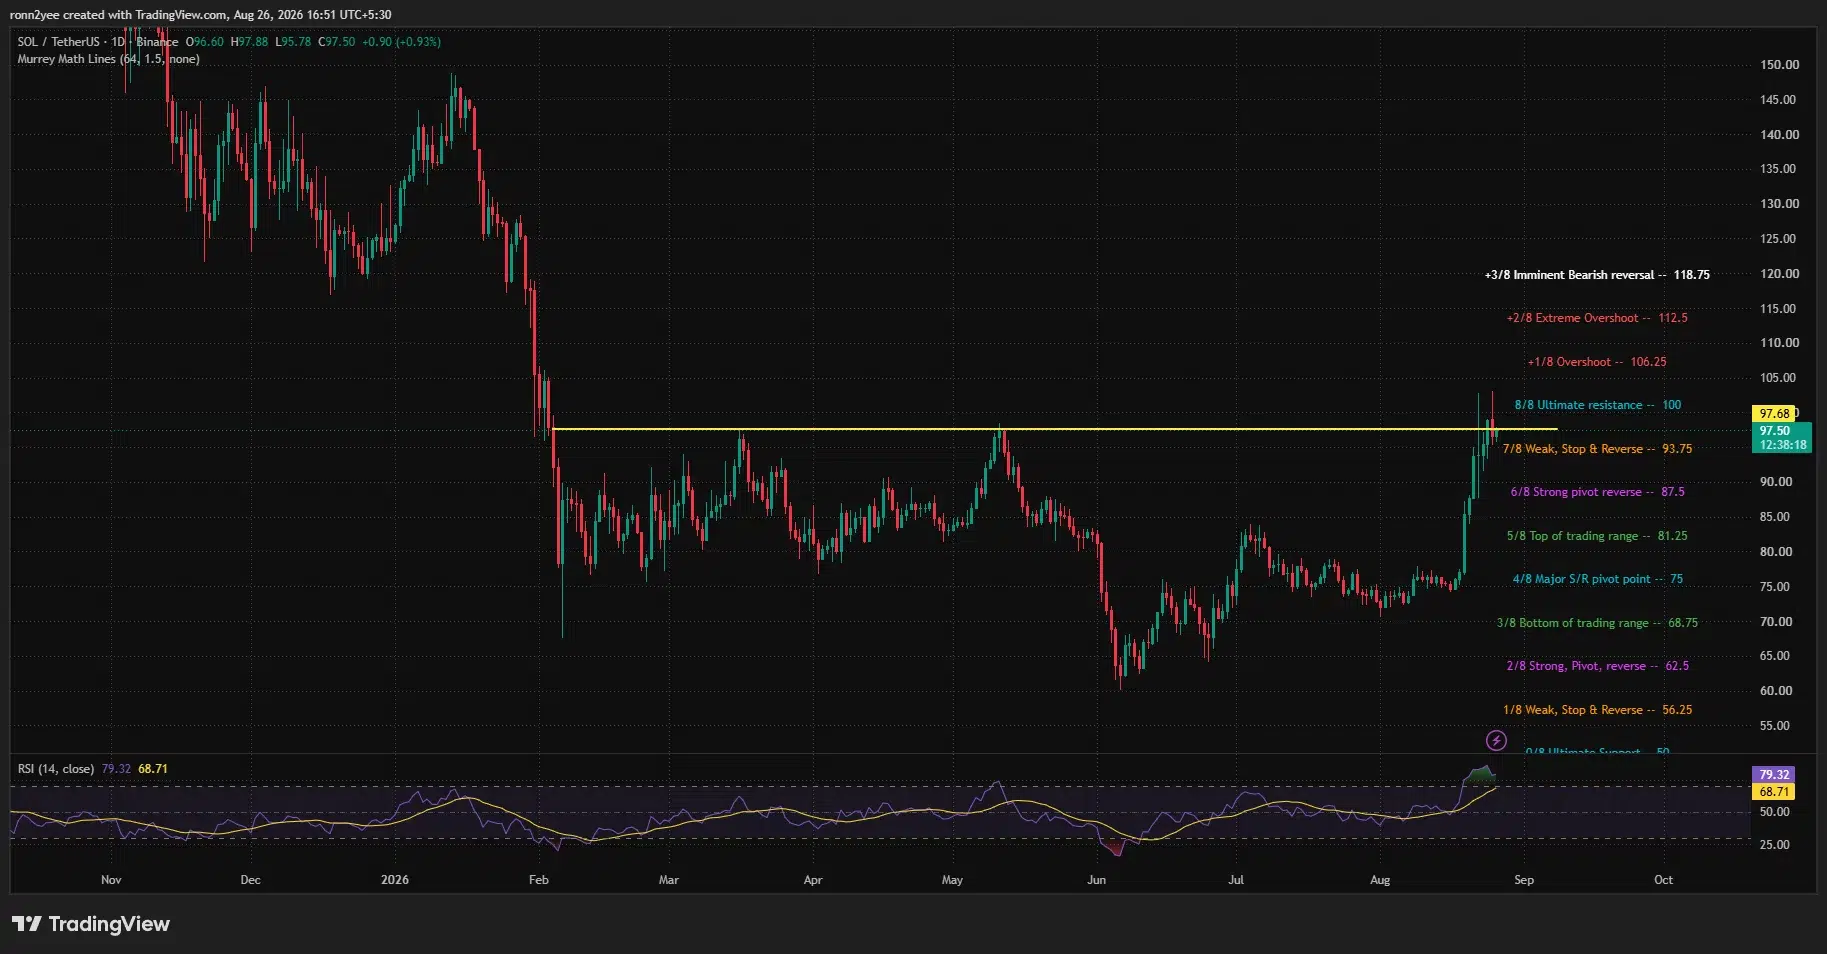
The pullback has not yet reversed the broader breakout. Solana remains above $93.75, while its recent candles show buyers returning whenever the price approaches $95.
However, the daily Relative Strength Index has climbed to 79.32, well above the commonly used overbought threshold of 70. Its moving average stands at 68.71, confirming that momentum accelerated rapidly during the latest rally.
An overbought RSI does not automatically signal an immediate decline, but it shows that SOL may need to consolidate before attempting another sustained move above $100.
Macro shift and short squeeze drive the rally
Solana’s advance occurred alongside a broader crypto market rally after liquidity actions by the U.S. Treasury pushed government bond yields lower and weakened the U.S. dollar.
Lower yields reduced pressure on risk assets and forced traders who had positioned for another market decline to close bearish bets. More than $4 billion in crypto short positions were reportedly liquidated over several days, creating forced buying across major digital assets.
Solana benefited from that market-wide squeeze because of its higher volatility relative to Bitcoin. Once SOL broke through the upper-$80 range, short covering and momentum buying helped carry the token through the psychological $100 barrier.
Improving U.S. regulatory expectations added to the change in sentiment. Investors responded to the Securities and Exchange Commission’s proposed crypto framework and renewed congressional attention on the Digital Asset Market Clarity Act.
Solana-specific developments also supported the move. The network community opened voting on a Resource Fee Proposal that would separate inclusion fees from compute resource fees and burn the latter in full.
SGP-0003: Resource and Inclusion Fee
— Solana Developers (@solana_devs) August 23, 2026
This SGP asks validators and delegators to endorse restructuring Solana's base transaction fee into a fixed base inclusion fee paid to the block leader and a separate resource fee that scales with requested transaction cost and is 100%…
Supporters expect the proposal to connect periods of high network use with higher SOL burns, although its final effect on supply would depend on adoption and future activity.
Institutional demand also strengthened during the week. Spot Solana exchange-traded funds recorded approximately $65.74 million in net inflows so far this week, their highest weekly inflows in 2026.
Network activity provided another source of support after Solana overtook Base in daily x402 micropayment transactions. Ramp’s integration of AI-agent wallet support on Solana also expanded the network’s potential role in automated payments.
4-hour chart shows buyers defending $96.67
Solana’s 4-hour Bollinger Bands show the price consolidating after a sharp expansion in volatility. SOL traded at $97.53, above the 20-period middle band at $96.67.
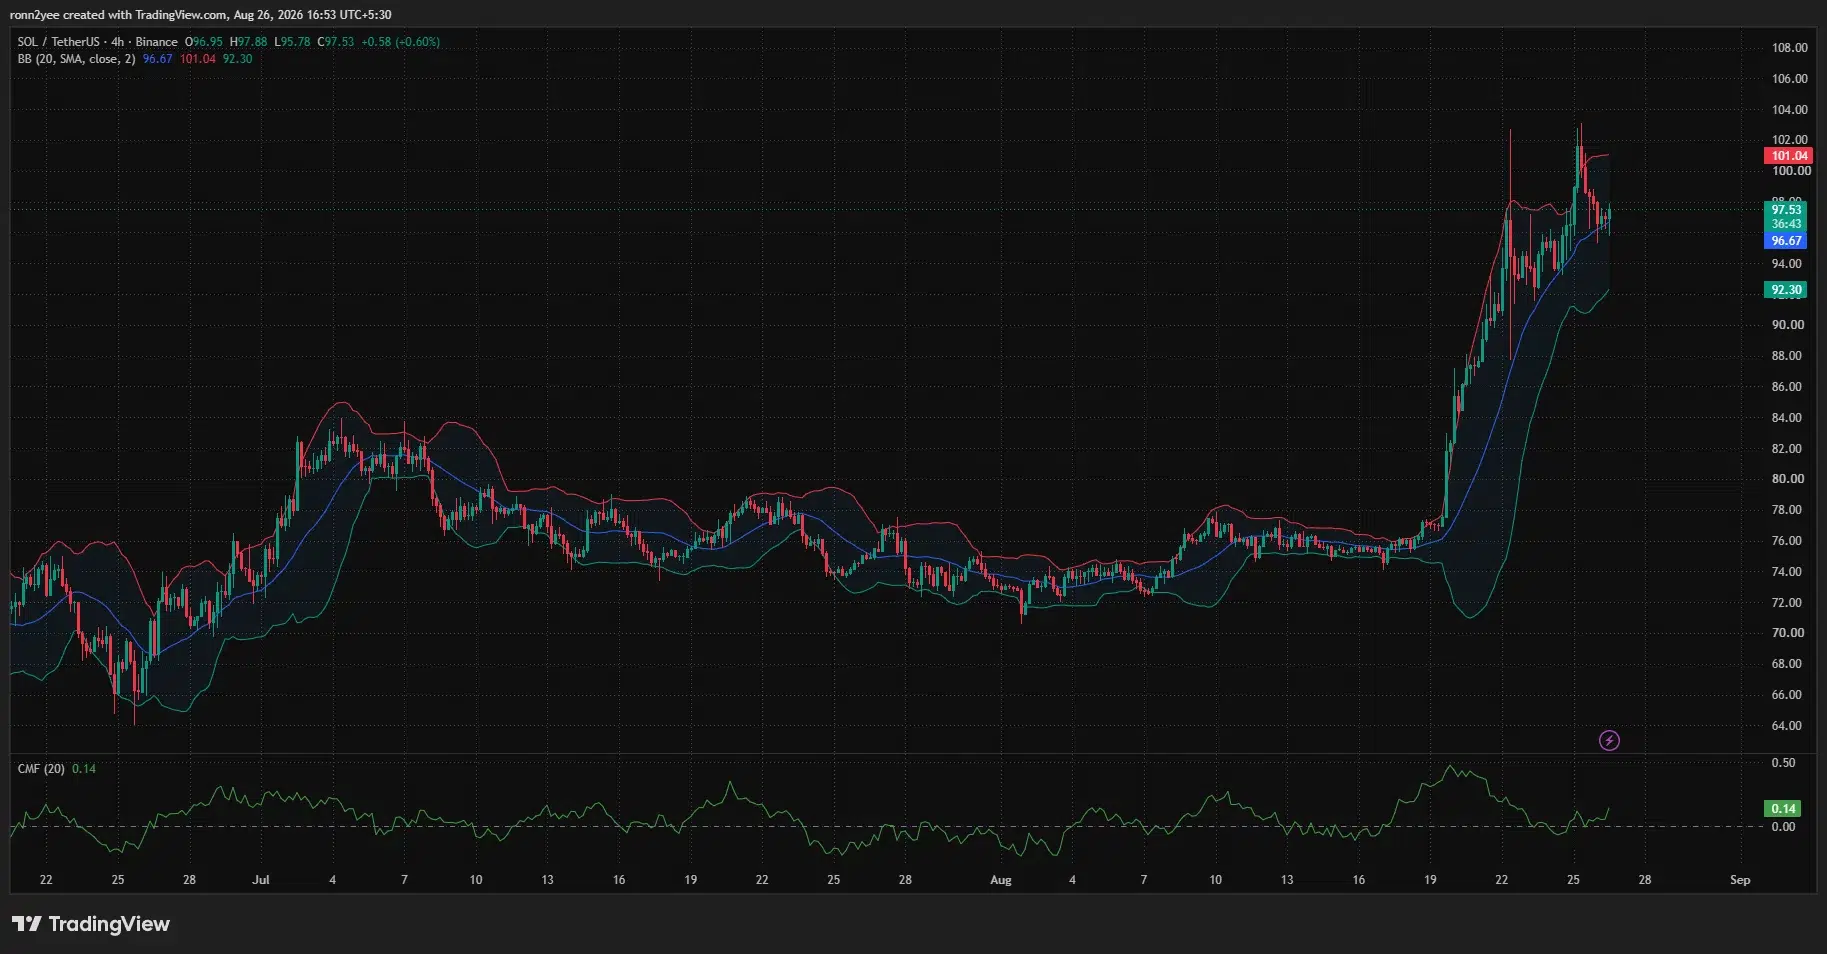
Remaining above the middle band keeps the short-term structure tilted toward buyers. The upper band at $101.04 represents the immediate technical barrier, closely matching the psychological $100 level and the recent rejection zone.
A 4-hour close above $101.04 could strengthen the case for another test of $102.59–$103.08. Clearing that area would leave $106.25, the next Murrey Math overshoot level, as a possible upside target.
The Chaikin Money Flow indicator stood at 0.14 on the 4-hour chart. A reading above zero suggests that buying pressure continues to exceed selling pressure despite SOL’s pullback from its weekly high.
The lower Bollinger Band at $92.30 forms the main short-term downside level. A break below the middle band could initially expose $93.75, followed by $92.30.
The daily chart places the next stronger support at $87.50. Losing that level would weaken the breakout and reopen the possibility of a move toward $81.25, which marked the top of SOL’s previous trading range.
Liquidation heatmap points to liquidity near $99
CoinGlass’ 24-hour liquidation heatmap shows dense leveraged positions immediately above Solana’s current price.
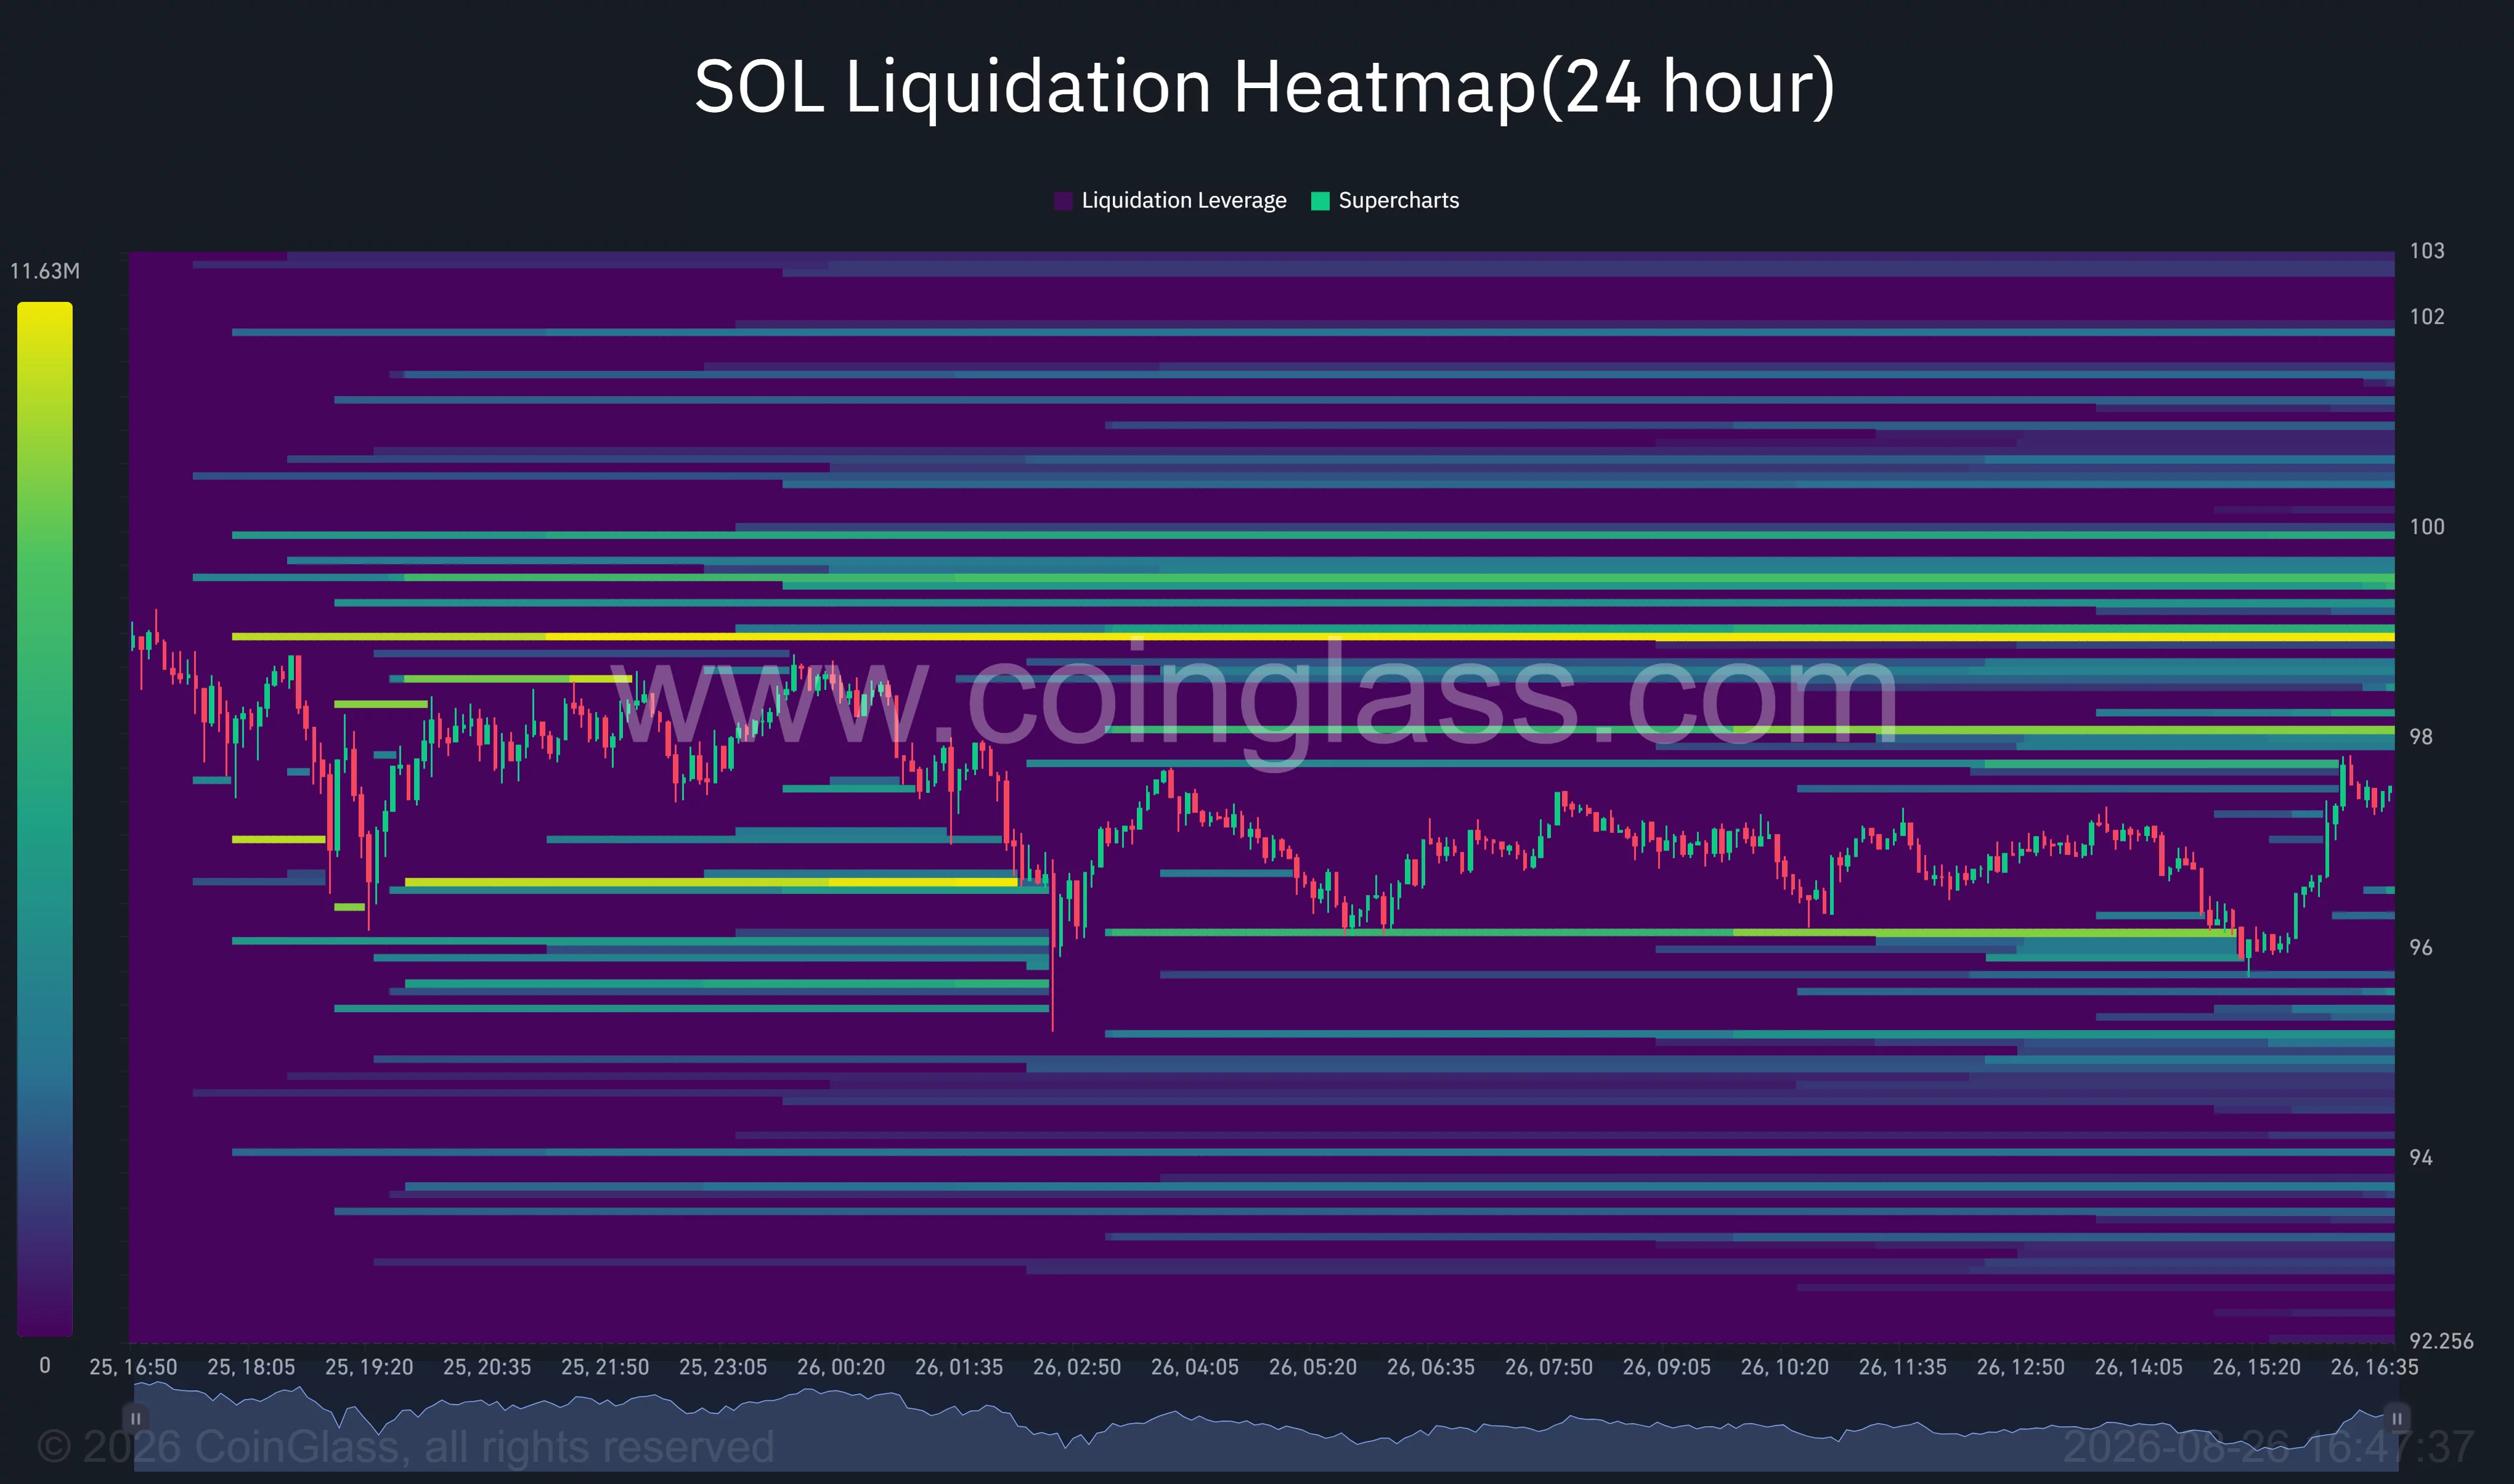
The strongest nearby concentration appears around $98.90–$99.10, with additional liquidity visible near $99.50 and $100. Such clusters can attract price because a move into them forces leveraged short positions to close.
If SOL crosses $99, liquidations could help accelerate another push toward $100–$103. However, the previous rejection above $102 shows that sellers are also active within that range.
Liquidity is visible below the market near $96, $95, and $94. A failure to break through the overhead cluster could therefore send SOL back toward lower-leveraged positions.
The heatmap supports a two-sided short-term setup: a break above $99 could generate another squeeze, while a rejection leaves $96 and $94 exposed.
Analysts split on $120 rally and $88 correction
Pseudonymous trader Altcoin Sherpa expects Solana’s advance to continue if conditions across the wider crypto market remain supportive.
“This goes to $120+ in the coming weeks as long as BTC is still stable/strong. Inflation going down, risk conditions going up, etc.”
A move to $120 from $97.50 would represent an increase of about 23%. Before reaching that target, SOL would need to clear resistance at $100, $103.08, $106.25, and $112.50.
Crypto analyst Haris offered a more cautious assessment, describing the current structure as a possible bull trap because of repeated resistance between $98 and $102.
“Price bounced hard, but $98–$102 is still rejecting. If SOL comes back there and gets rejected again, I will open a short.”
Haris identified $92 as the first downside target. According to the analyst, failure to hold that level could lead to a deeper decline toward $80–$88.
Solana’s immediate direction therefore depends on whether buyers can turn $100–$103 into support. Holding above $96.67 preserves the short-term bullish structure, while a drop through $92.30 would favor a broader retest of the breakout.