Ripple Price Analysis: XRP Rejected at Key Resistance Again – Is $1.00 Next?
XRP had recovered toward $1.34 after briefly dipping near $1.20 last week before it dumped to $1.26 minutes ago, with the latest push lifting the token above the upper boundary of its short-term descending channel on the 4-hour chart. The rebound has kept the $1.25 support intact, but the asset still faces several supply zones above before the broad bullish trend is restored.
Ripple Price Analysis: The USDT Pair
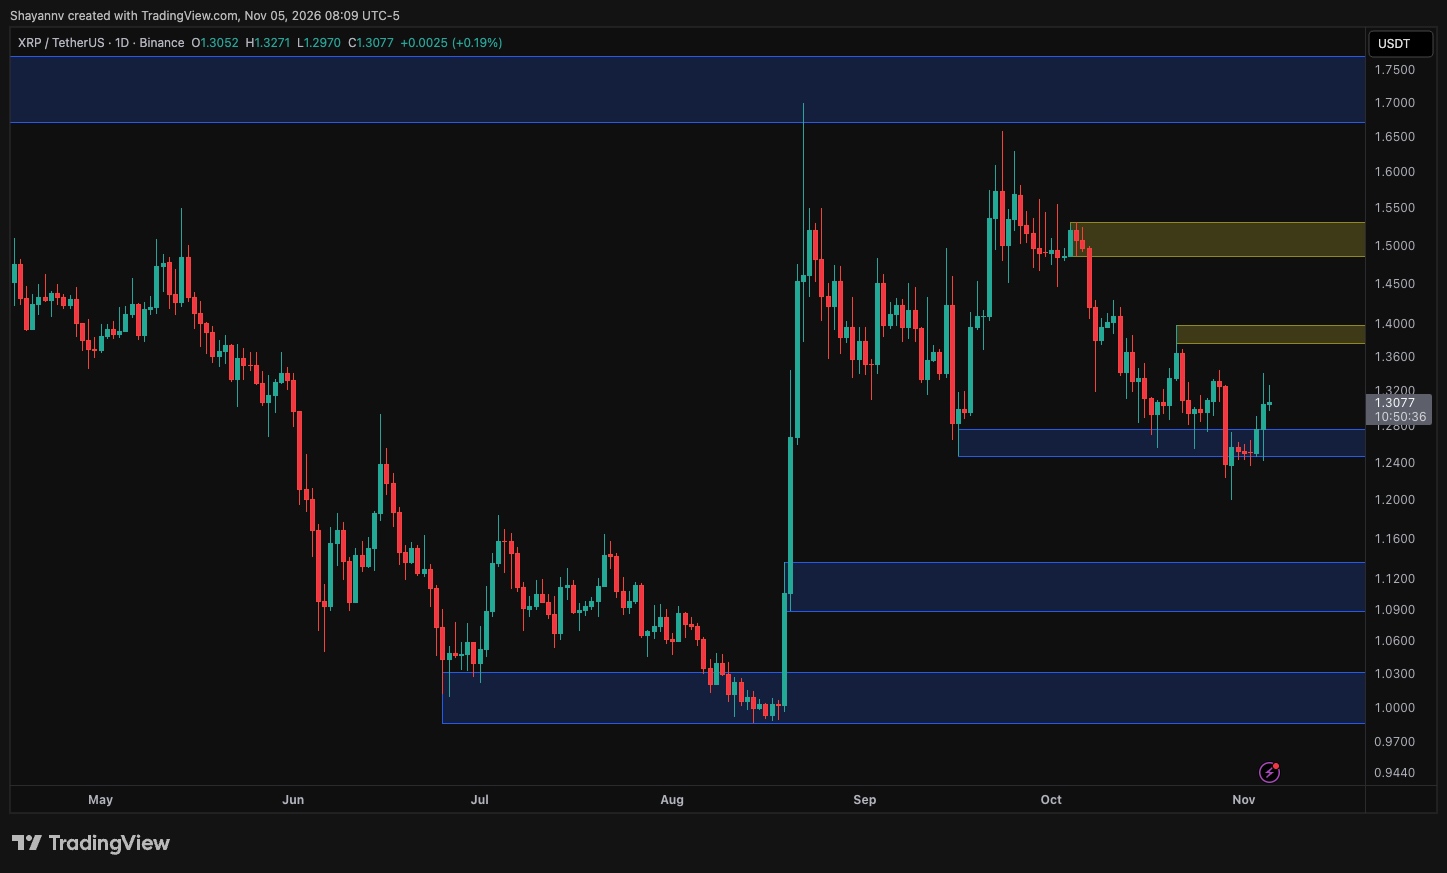
The daily chart shows XRP still trading within the broader range formed after the sharp August rally from the $1.00 region. The rejection from the $1.70 resistance level in late September started a sequence of lower highs. The decline eventually dragged the price into the $1.25 demand zone, which marks the base of the mid-September rebound.
Sellers briefly pushed XRP below this area at the end of October, with a long lower wick reaching around $1.20. Buyers quickly absorbed the move, however, and the price has since closed back above the zone. If the rebound holds, which doesn’t appear to be the case as of now, the first resistance lies at the $1.40 October lower high, followed by the $1.50 region, where a strong bearish order block is located.
On the contrary, a decisive drop below $1.25 would invalidate the recent reclaim and expose the $1.10 zone. Below that, the $1.00 region remains the major floor, having held throughout July and August before the rally began. At the top of the range, the $1.70 supply zone remains the main long-term obstacle for buyers.
The 4-Hour Chart
The 4-hour chart highlights a notable shift in short-term structure. Since peaking just below $1.70 in late September, XRP has been trending lower within the orange descending channel, with each rally rejected at the upper boundary, including the October 21 attempt that created the $1.40 supply zone. After a week of tight base-building around $1.25, the price has now broken above the channel’s upper trendline.
The breakout lifted XRP to about $1.34 before a major pullback pushed it to $1.26, suggesting the price may need more time to return to the $1.40 area. Still, if buyers maintain control, the asset could attempt a relief rally toward the $1.40 zone soon, which is the most recent lower high and the first real test of the breakout. Reclaiming that level would strengthen the reversal case and bring the key $1.50 area back into focus.
However, a return below the broken trendline and the $1.25 demand zone would suggest that the move was a false breakout. In that scenario, the lower channel boundary near $1.15 and the daily $1-$1.10 demand zone would become the next downside levels. For now, the short-term structure leans constructive, but confirmation would require buyers to hold $1.25 and clear $1.40.
