Pi Network price slips below $0.09 as moving averages cap rebound

Pi Network price fell back toward $0.088 on Sep. 23 after an intraday move above $0.092 failed to hold. The pullback came as traders weighed recent network upgrades against a daily chart that still shows PI below its main moving averages.
- Pi Network price traded near $0.0882 after reaching $0.0926 earlier in the daily session.
- The daily 50-day and 100-day moving averages stood near $0.0909 and $0.0970.
- A 4-hour Supertrend level near $0.0861 remained below the price.
- Pi Network said more than 417,000 users can resume identity verification after an account review.
According to the PI/USDT daily chart, the token opened near $0.0903, reached $0.0926, and fell as low as $0.0858 before trading around $0.0882. The move left PI below $0.09 despite a rebound from the session low.
CoinGecko listed PI near $0.0883, down about 0.7% over 24 hours but up roughly 7.3% over seven days. The weekly gain gives the latest decline a different scale from the longer slide visible on the daily chart.
Pi Network price faces a test at $0.0909
The daily chart places PI below its 50-day moving average of about $0.0909 and its 100-day moving average near $0.0970. Both lines slope downward, and the shorter average remains beneath the longer one. PI would first need to recover $0.0909 to challenge the area around $0.0926, where the latest advance stalled.
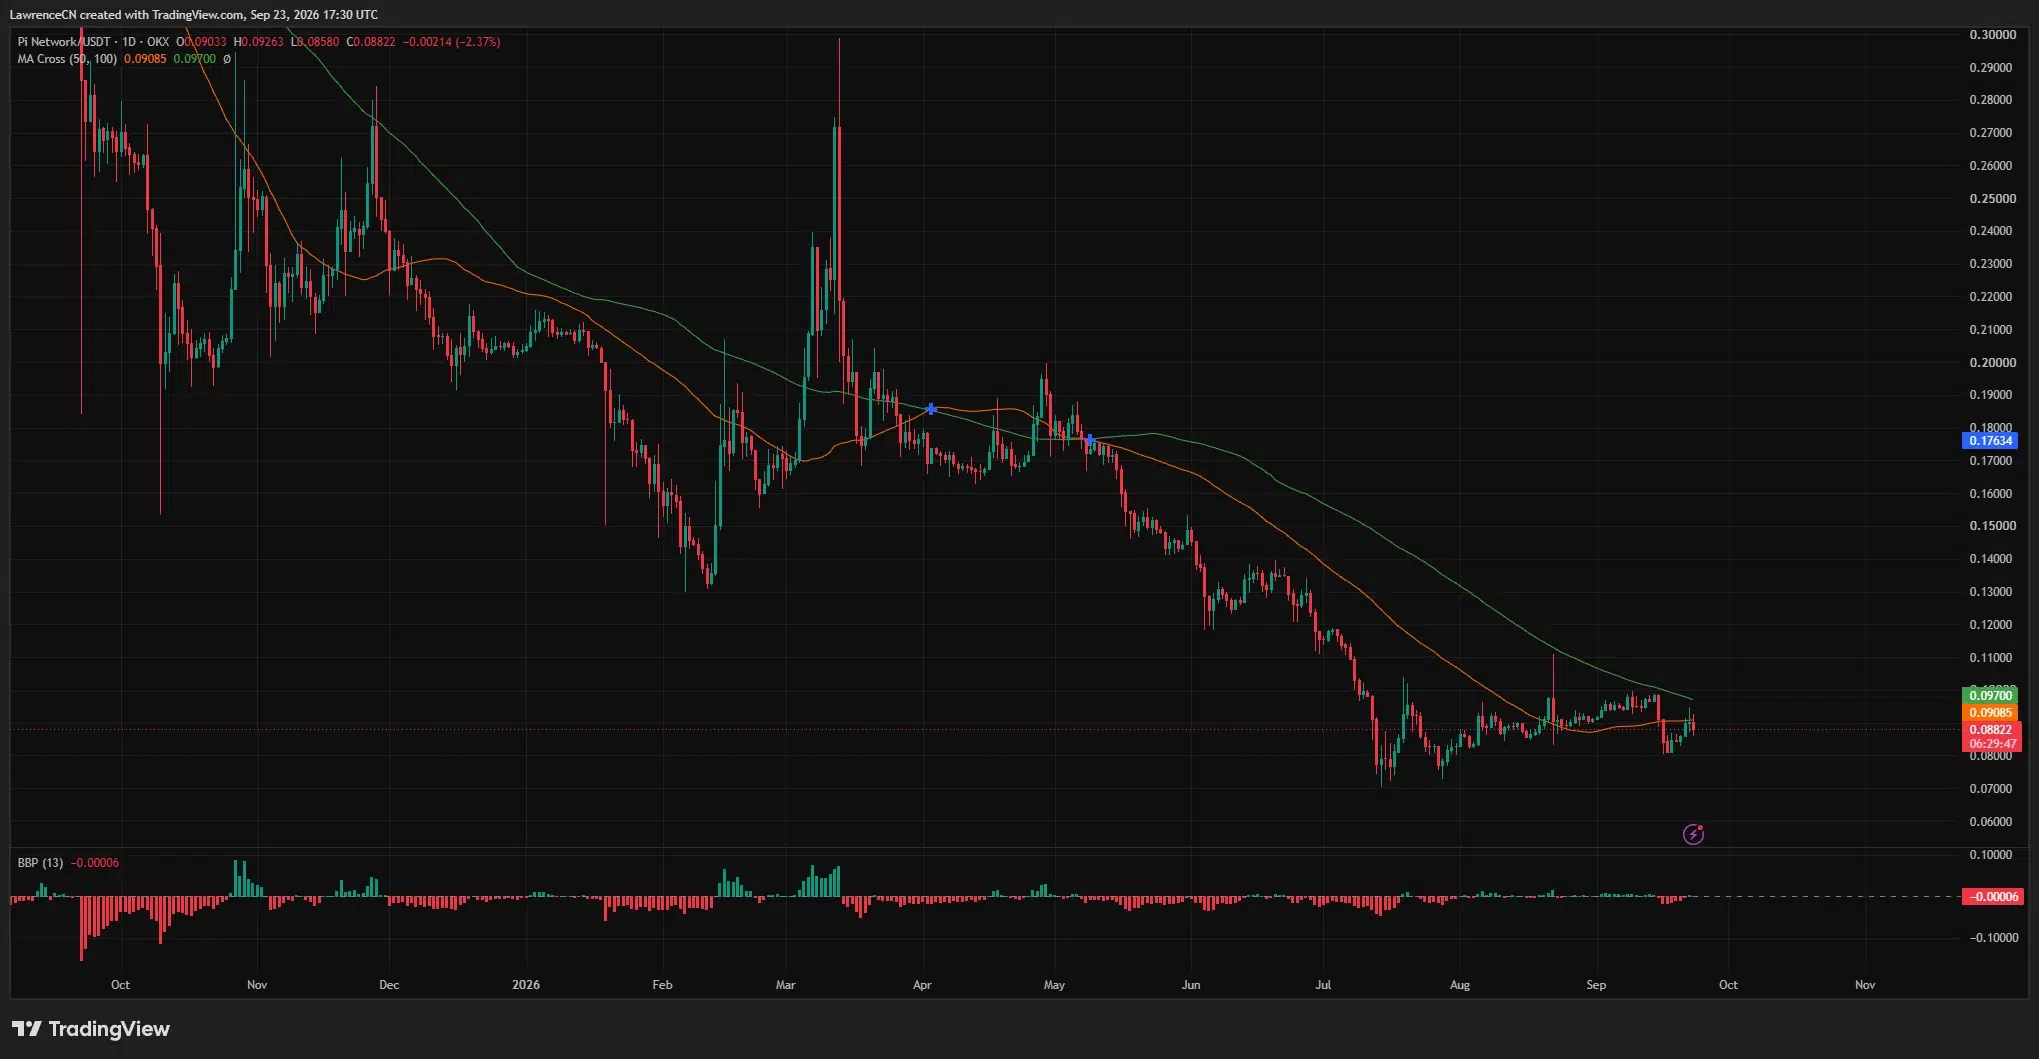
A move through that range would bring $0.0970 into view. PI traded close to $0.098 during its earlier September rise before losing ground, making the 100-day average a useful level for judging whether a recovery extends beyond a brief bounce.
On the downside, the latest daily low near $0.0858 is the first level to watch. The chart then shows a recent trading area around $0.080 to $0.083. A daily close below that area would put the July lows, near $0.07, back in focus.
The daily Bear Bull Power reading was slightly negative, near −0.00006. Its small size points to limited momentum in either direction at the chart’s latest reading, even though price remains below both moving averages.
A 4-hour rebound is still holding above $0.0861
The shorter timeframe gives buyers one firmer signal. The 4-hour Supertrend line stood near $0.0861, below PI’s price of about $0.0882. PI also recovered after a sharp fall toward $0.081 earlier in the week, then reached the $0.091 to $0.092 area before pulling back again.
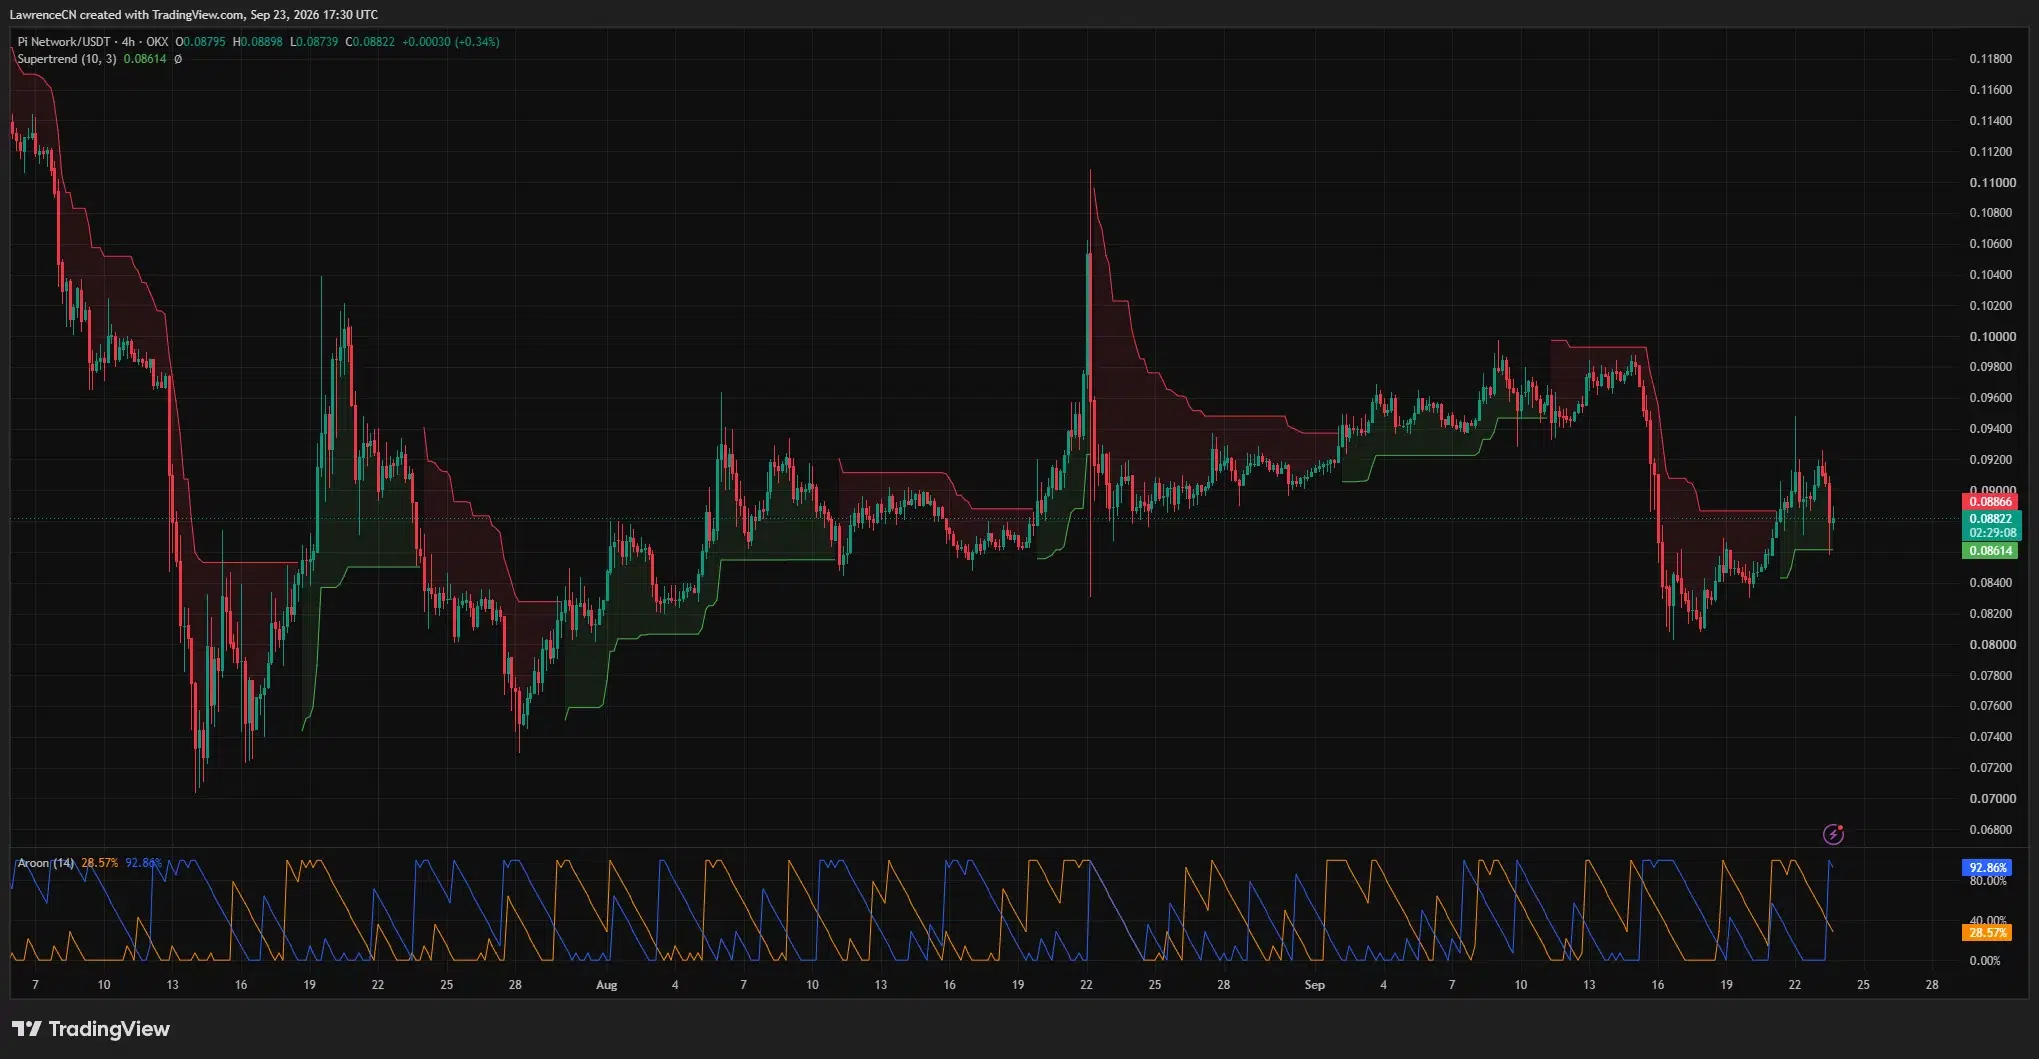
The 4-hour Aroon indicator showed its up line near 92.86% and down line near 28.57%. Those readings reflect a more recent high than low within the indicator’s lookback period. They fit the recovery from this week’s low, though the failed push past $0.092 shows that the rebound has yet to clear nearby resistance.
A sustained break below the Supertrend level around $0.0861 would weaken the short-term setup and expose the $0.083 to $0.081 area. If buyers instead regain $0.09 and close above $0.0926, the daily 100-day moving average near $0.0970 becomes the next larger test. Both paths depend on levels the charts have already shown; neither is a confirmed outcome.
KYC progress brings more users closer to migration
Pi Network said on Sep. 17 that more than 417,000 users previously flagged as possible duplicate accounts can move forward with identity verification. The team also said it planned an update to address a separate issue affecting 497,000 users who were stuck in the migration process. The second group should not be counted as already unblocked.
The project has also been moving through a series of protocol upgrades. Its node page says mainnet nodes must upgrade to Protocol v27. These changes may affect access and network use over time, but the announcements alone do not establish why PI fell during the Sep. 23 session.
Migration also does not automatically mean that newly eligible users will sell tokens. For traders, the measurable near-term question is whether demand can carry PI back above the $0.0909 to $0.0926 resistance range. The token remains more than 97% below its February 2025 peak of roughly $2.99, according to crypto.news’ account of its first year on open mainnet. At the current price, a short-term recovery would still leave that larger decline intact.
For U.S. readers tracking PI, the same chart levels provide a clearer test than the upgrade calendar: $0.0861 is the nearby 4-hour support signal, while a daily move above $0.0909 and $0.0926 would show whether buyers can sustain the rebound.