NEAR price outlook: Can $4.69 support absorb the Intents selloff?

NEAR price fell below $5 on Oct. 1 following a reported $3.8 million exploit involving NEAR Intents, with the token trading near $4.94 as its recent rally met a sharp pullback.
- NEAR price traded near $4.94, with TradingView showing a 7.55% daily decline and a $4.74 low.
- NEAR Intents pledged full reimbursement after patching a contract vulnerability linked to its Omni system.
- The 4-hour chart places nearby resistance at $5.02, while daily support sits around $4.69.
- Rekt Capital sees a potential breakout retest after NEAR’s monthly close above a long-term downtrend.
NEAR Intents said the incident involved a bug in the interaction between its Omni deposit and withdrawal system and the platform’s smart contract. The team paused services, patched the contract-side vulnerability, and committed to reimbursing affected funds in full.
Earlier today NEAR Intents services were stopped after a security incident was detected. The incident was caused by a bug in the Omni deposit and withdrawal infrastructure interaction with NEAR Intents smart contract.
— NEAR Intents (@near_intents) October 1, 2026
The preliminary report indicates the total loss of…
Reports noted that the disruption affected cross-chain infrastructure associated with NEAR Intents, rather than the underlying NEAR Protocol blockchain. The platform also reported the incident to law enforcement and engaged security and blockchain analytics firms to trace the funds.
NEAR price falls below $5 after testing $5.54
TradingView’s Binance daily chart places NEAR at $4.938, down 7.55%, with a daily high of $5.540 and a low of $4.742. The price stood about 10.9% below that high at the chart snapshot.
The daily chart shows the retreat following a steep September advance from roughly the mid-$2 range. NEAR crossed several price levels during that climb before reaching the $5.50 area, where the latest decline began.
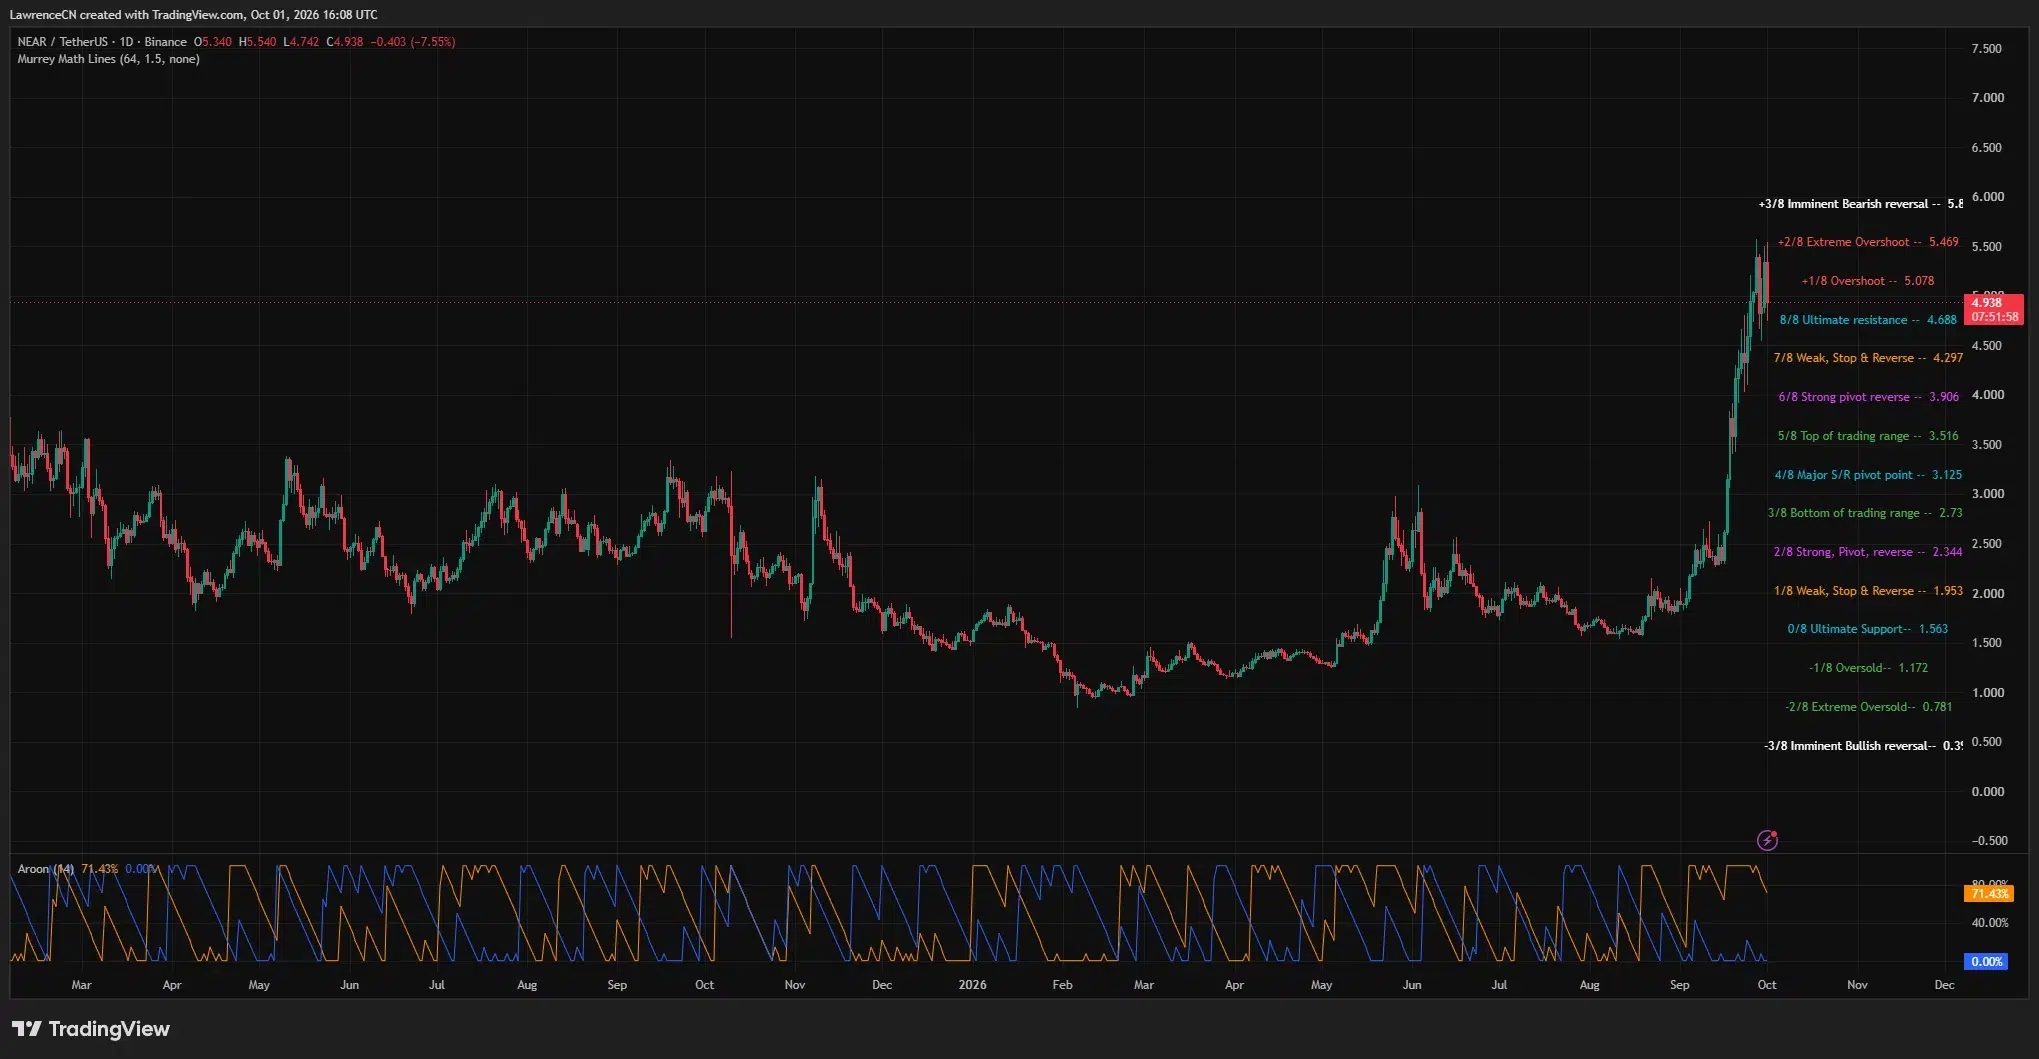
The Murrey Math indicator places NEAR below its $5.078 overshoot level after the price briefly moved beyond the $5.469 extreme-overshoot line. Both levels now sit above the market, creating nearby hurdles for a recovery.
The next marked daily level below the price is $4.688. NEAR’s $4.742 daily low remained just above that line, making the $4.69–$4.74 area the nearest chart-based support zone.
A move below that area would bring the indicator’s $4.297 level into view, followed by $3.906. Those levels form a conditional downside map from the daily chart, with each lower target depending on a break of the preceding support.
The daily Aroon indicator still shows Aroon Up at 71.43% and Aroon Down at 0%. Recent highs therefore remain more prominent within its lookback period, even as the latest price decline interrupts the September advance.
NEAR needs to reclaim $5.02 on the 4-hour chart
TradingView’s 4-hour chart shows NEAR at $4.937, below the Bollinger Bands’ middle line at $5.022. The upper band stands at $5.468, while the lower band sits at $4.577.
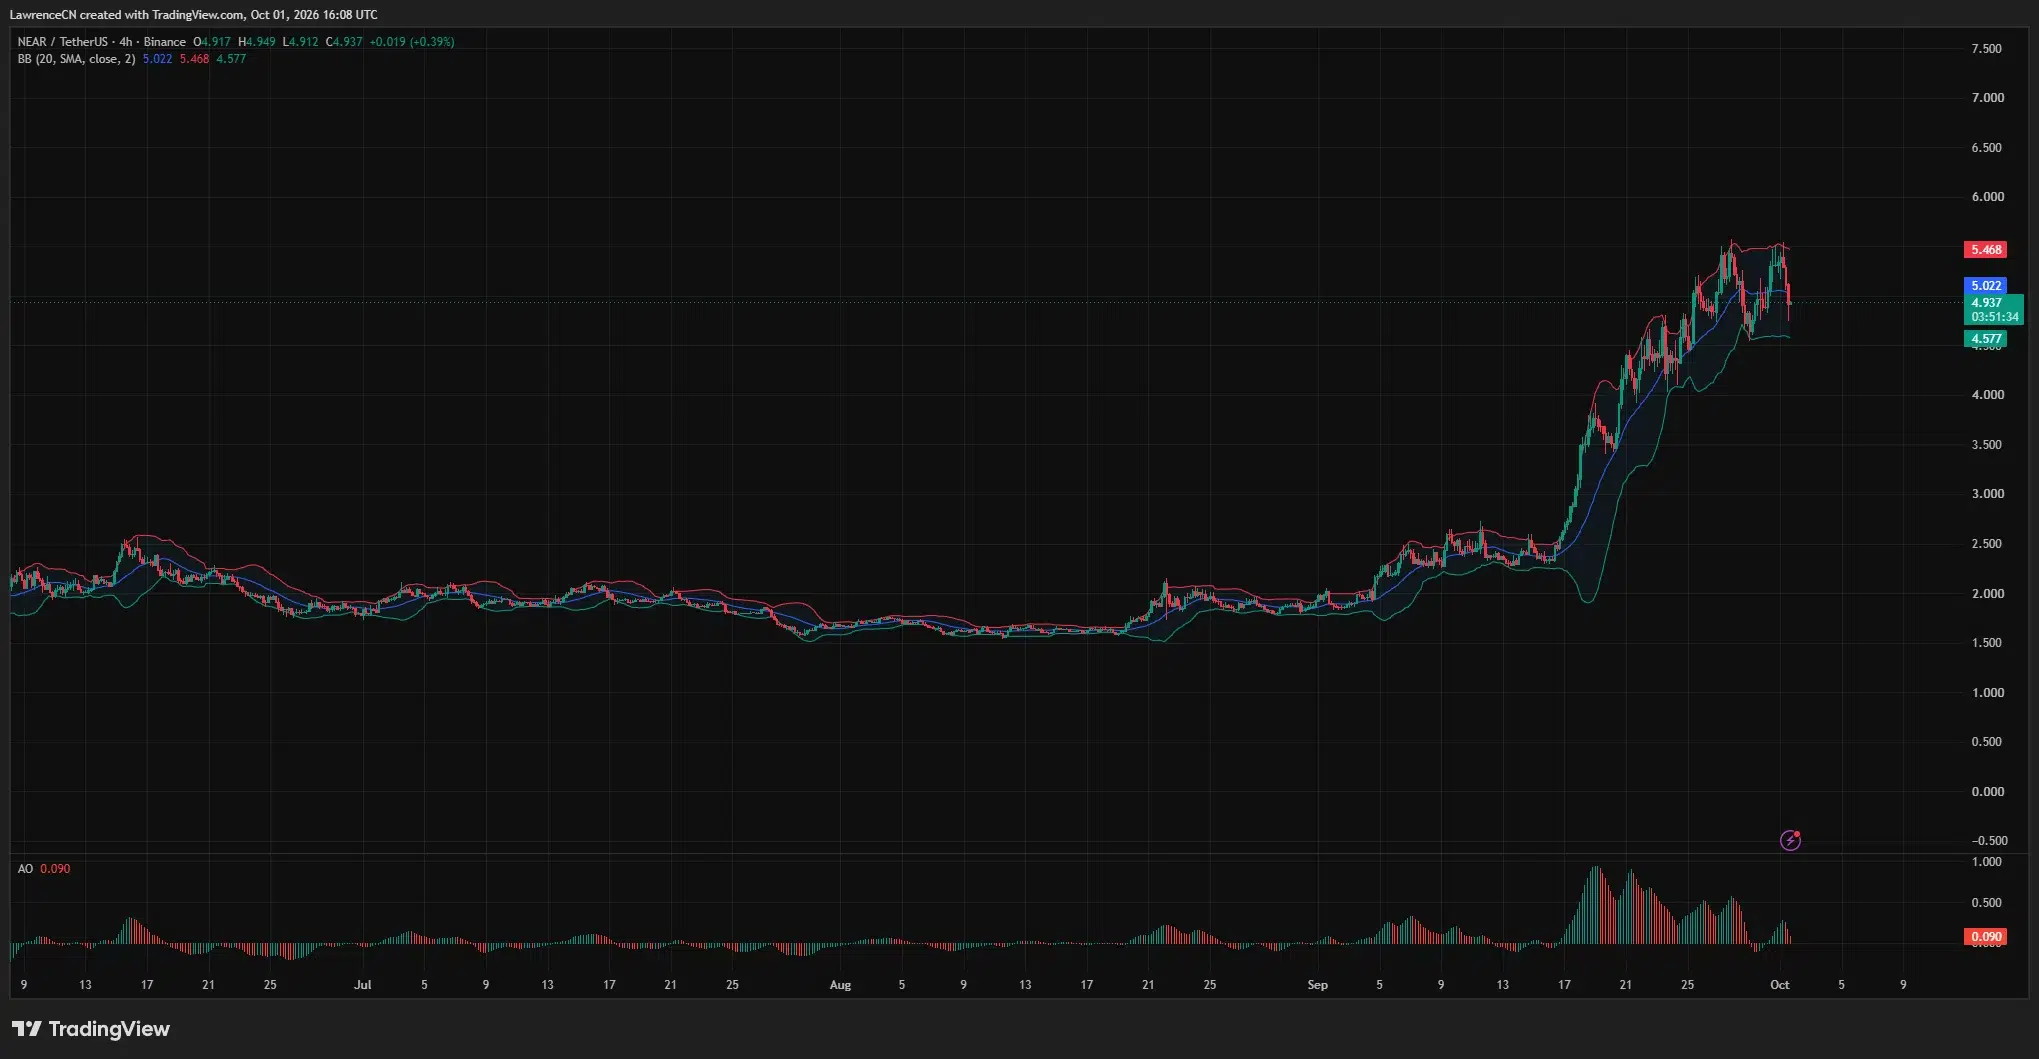
The middle band provides the first nearby recovery level. A sustained move above $5.02 would also return NEAR above the $5 threshold, although the daily chart’s $5.078 line would remain a further obstacle.
The upper Bollinger Band almost matches the daily Murrey Math level at $5.469. That overlap places two separate chart references around $5.47, close to the recent highs near $5.54.
On the downside, the lower band at $4.58 sits beneath the daily chart’s $4.69 support. A failure to hold the daily support zone would therefore leave another nearby reference around $4.58 before the lower daily levels.
The 4-hour Awesome Oscillator remains positive at 0.090, but its latest histogram bar is red. Momentum remains above the indicator’s zero line while weakening compared with the preceding bar.
NEAR also remains well above its earlier September trading range around $2.30–$2.60 on the same chart. The immediate pullback and the larger monthly advance are visible across different timeframes.
Liquidation clusters sit above $5 and below $4.80
CoinGlass’s one-week liquidation heatmap shows NEAR retreating from the $5.50 area toward $4.90, with a sharp downward move near the right edge of the chart.
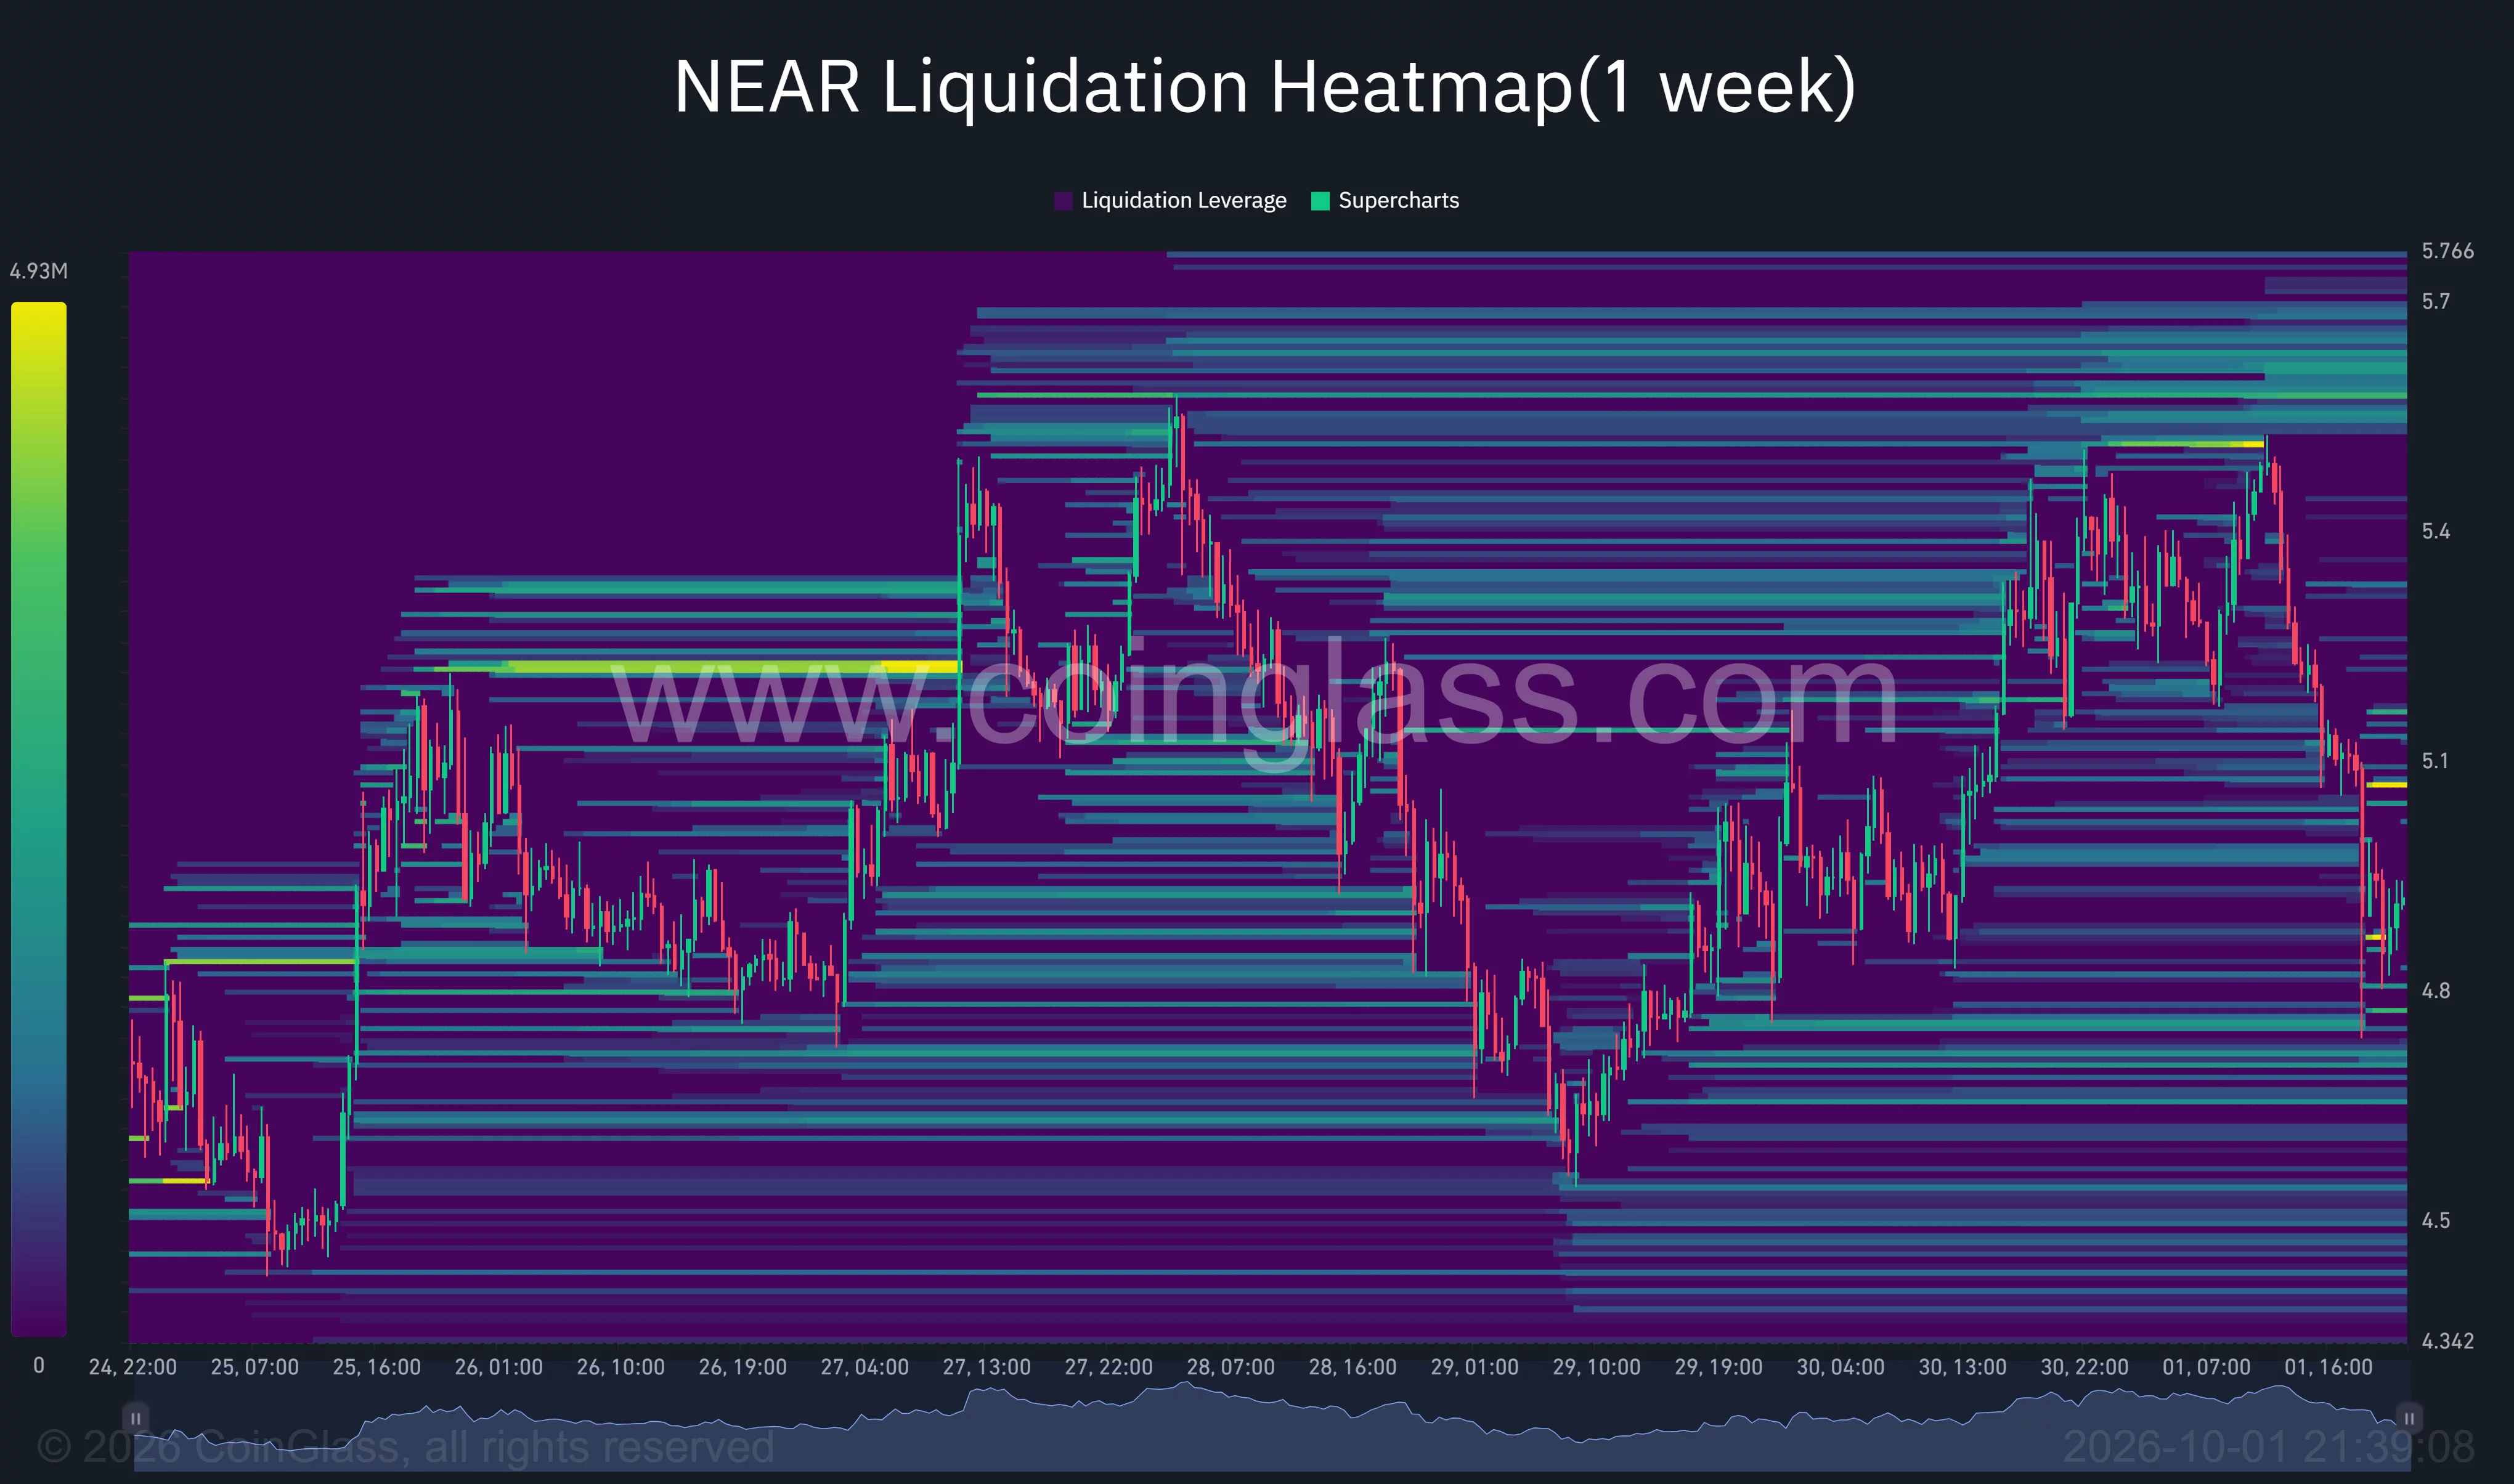
A bright nearby liquidation cluster sits around $5.05–$5.10. Higher concentrations appear around $5.50 and across parts of the $5.60–$5.70 range.
Below the market, the heatmap shows several bands around $4.70–$4.80, followed by further concentrations near $4.60 and $4.45–$4.50. The $4.70 area overlaps the daily chart’s nearest support zone.
Taken together, the chart-based recovery path runs through $5.02–$5.10 before the $5.47–$5.54 region. The downside path begins around $4.69–$4.74, followed by the lower Bollinger Band near $4.58.
Analysts watch the breakout retest as NRR enters U.S. markets
Rekt Capital said in an Oct. 1 X post that NEAR had rallied about 265% since a major trend reversal and recorded a monthly close above its macro downtrend for the first time in years.
The analyst expects NEAR to attempt a retest of that former downtrend as support. His monthly chart marks horizontal levels at approximately $3.798 and $5.978, giving the longer-term assessment a wider range than the immediate daily setup.
In a separate Oct. 1 post, trader CW said accumulation signals persisted and argued that repeated replenishment of momentum supported the possibility of a sustained rally. Both analysts’ views remain conditional as NEAR trades below $5.
The retreat also follows a new U.S. investment product. Bitwise announced that its NEAR ETF began trading on NYSE Arca on Sep. 29 under the ticker NRR, with a 0.75% management fee and plans to stake its NEAR holdings. The issuer also said NEAR’s inflation rate had recently been halved to 2.5%.
For the immediate price setup, the daily and 4-hour charts place $4.69–$4.74 at the center of the downside test. A recovery would first need to clear $5.02–$5.10 before revisiting the resistance around $5.47.