Hedera price jumps 30% as RSI tops 80 and AI post draws attention
Hedera price surged about 30% on Sep. 28, climbing above $0.12 as traders reacted to a sharp chart breakout and a new post linking Hedera Council members to NVIDIA’s AI safety initiative.
- Hedera price reached $0.12576 on Binance after opening the daily session near $0.09586.
- The daily relative strength index rose to 81.03, above the commonly watched overbought threshold of 70.
- Hedera pointed to council representation in NVIDIA’s Open Agent Safety Platform announcement.
- A 24-hour liquidation heatmap shows a large cluster near $0.108, below the latest price.
Hedera (HBAR) price traded near $0.1247 on Binance at the time of writing, according to the TradingView 4-hour chart. The move took the token above $0.10, a level it had struggled to hold during the preceding week, and past the chart’s upper Bollinger Band at $0.11346.
The latest reading is higher than the roughly $0.119 price cited earlier in the day. It also changes the immediate technical picture: HBAR had climbed back toward its daily high after an intraday pullback, rather than continuing to fall from it.
Hedera’s NVIDIA post adds to attention around the rally
Hedera posted on Sep. 28 that Hedera Council members appeared among the organizations represented in NVIDIA’s Open Agent Safety Platform announcement. The post shared an image from NVIDIA CEO Jensen Huang showing a broad group of industry participants, including Accenture and EQTY Lab.
Great to see Hedera Council representation on the NVIDIA Open Agent Safety Platform 👀
— Hedera (@hedera) September 28, 2026
Trust and safety are what the AI economy needs to scale responsibly. https://t.co/EZUF1SBlSA
Hedera described the development as council representation on the platform. Its post came during the same day as HBAR’s price surge, giving traders a fresh AI-related development to follow. The announcement does not specify a new NVIDIA deployment on the Hedera network or a resulting volume of HBAR transactions.
The companies have an existing connection through work on AI oversight. In a case study, Hedera says its Consensus Service is used to create timestamped records of AI actions in a public-sector project involving Accenture and EQTY Lab. EQTY Lab supplies tools to verify AI activity, while Accenture is developing plans to bring the system into public-sector software.
That project predates Monday’s trading. Hedera Foundation announced its work with Accenture and EQTY Lab in June 2025, and Accenture joined the Hedera Council in April 2026. Monday’s post renewed attention to those ties as the token broke higher.
The U.S. connection runs through the public-sector focus of the Accenture and EQTY Lab project. Hedera says the system was demonstrated in Washington for government uses, including emergency management and cyber incident response. The project’s existing scope provides context for the AI narrative, while the price charts show the scale of the latest market reaction.
HBAR breaks above $0.12 as daily RSI reaches 81
TradingView’s Binance daily chart shows HBAR opening at $0.09586, falling as low as $0.09415 and then reaching $0.12576. At about $0.12468, the token was up 30.06% from the daily open.
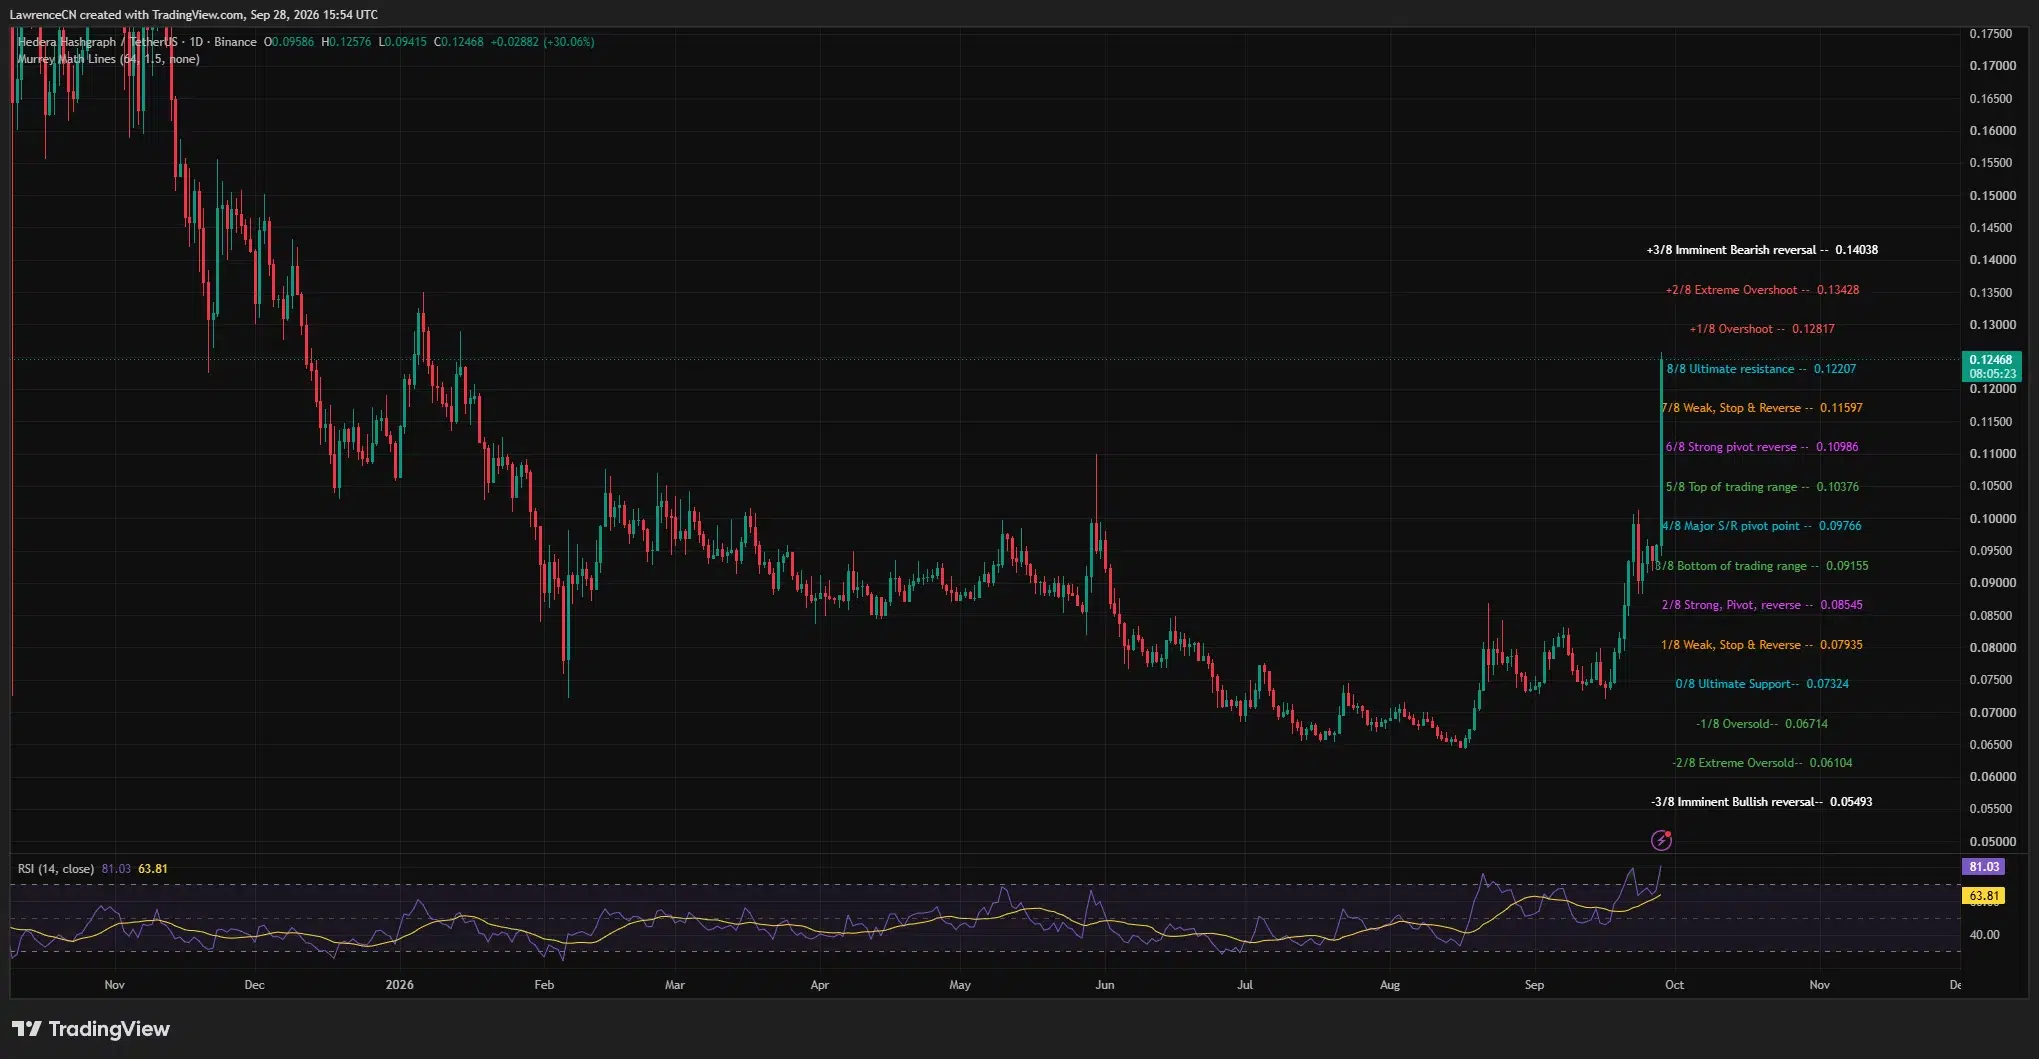
The advance carried HBAR through several marked levels on the daily chart. Price cleared $0.09766, $0.10376, $0.10986, and $0.11597 before moving above the $0.12207 Murrey Math resistance level. The next marked levels are $0.12817 and $0.13428 if the breakout extends.
The daily RSI stood at 81.03, compared with its signal line at 63.81. A reading above 70 marks strong upward momentum but also shows how far the move has stretched in a short period. The chart’s price path is steep: HBAR spent much of the prior week below $0.10 before rising above $0.12 in one session.
On the 4-hour chart, the Bollinger Band midpoint stood at $0.09728 and the upper band at $0.11346. HBAR’s move well above the upper band shows that the latest candles are trading outside their recent range. The 4-hour ADX read 34.56, indicating a strong trend, although ADX alone does not show whether that trend will continue.
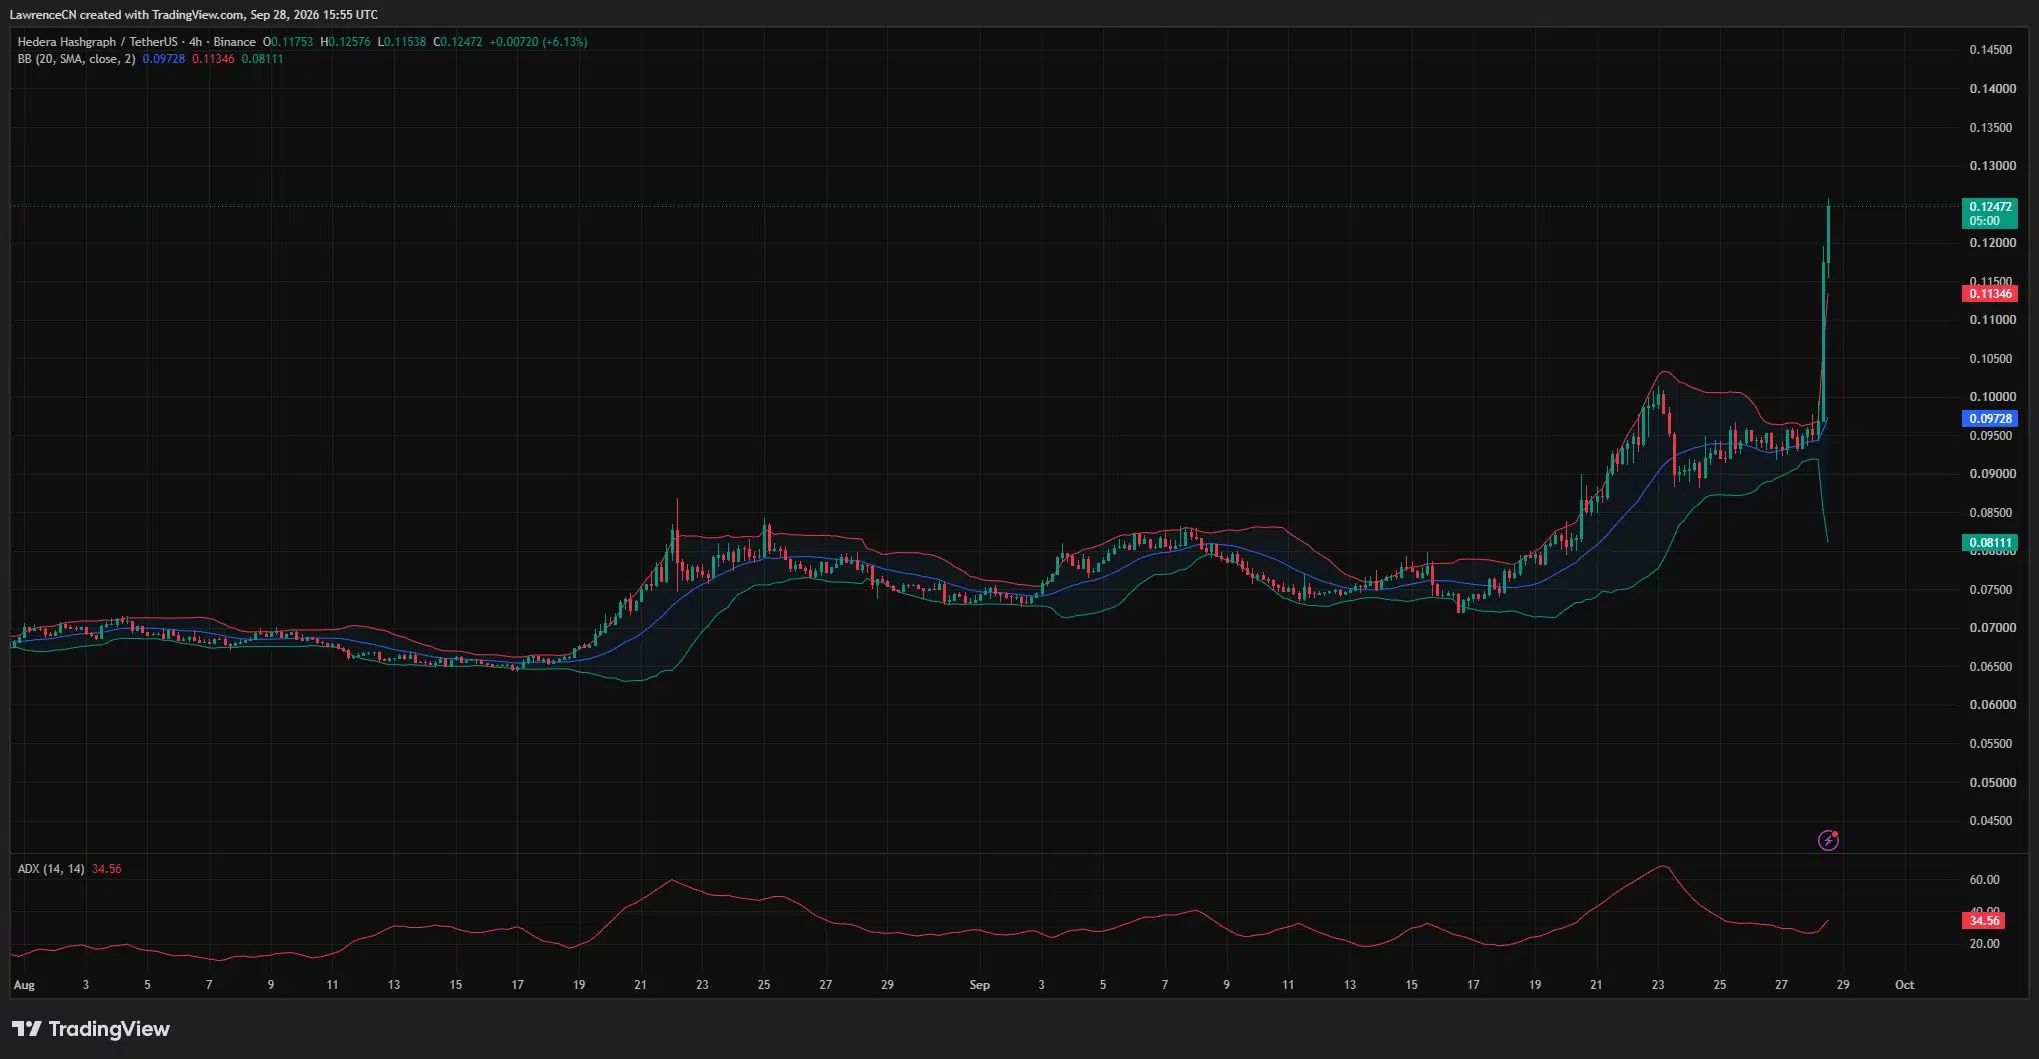
The daily high of $0.12576 is the nearest observed upside test. Above it, the marked $0.12817 level would come into view. A retreat below $0.12207 would put $0.11597 and the 4-hour upper Bollinger Band near $0.11346 back in focus. The former resistance area around $0.10 is farther below.
Liquidation heatmap places a large cluster near $0.108
CoinGlass’s 24-hour HBAR liquidation heatmap shows price rising from below $0.10 to roughly $0.125 by the end of the displayed period. Liquidation levels are scattered above $0.12, with additional bands near $0.126 and $0.127.
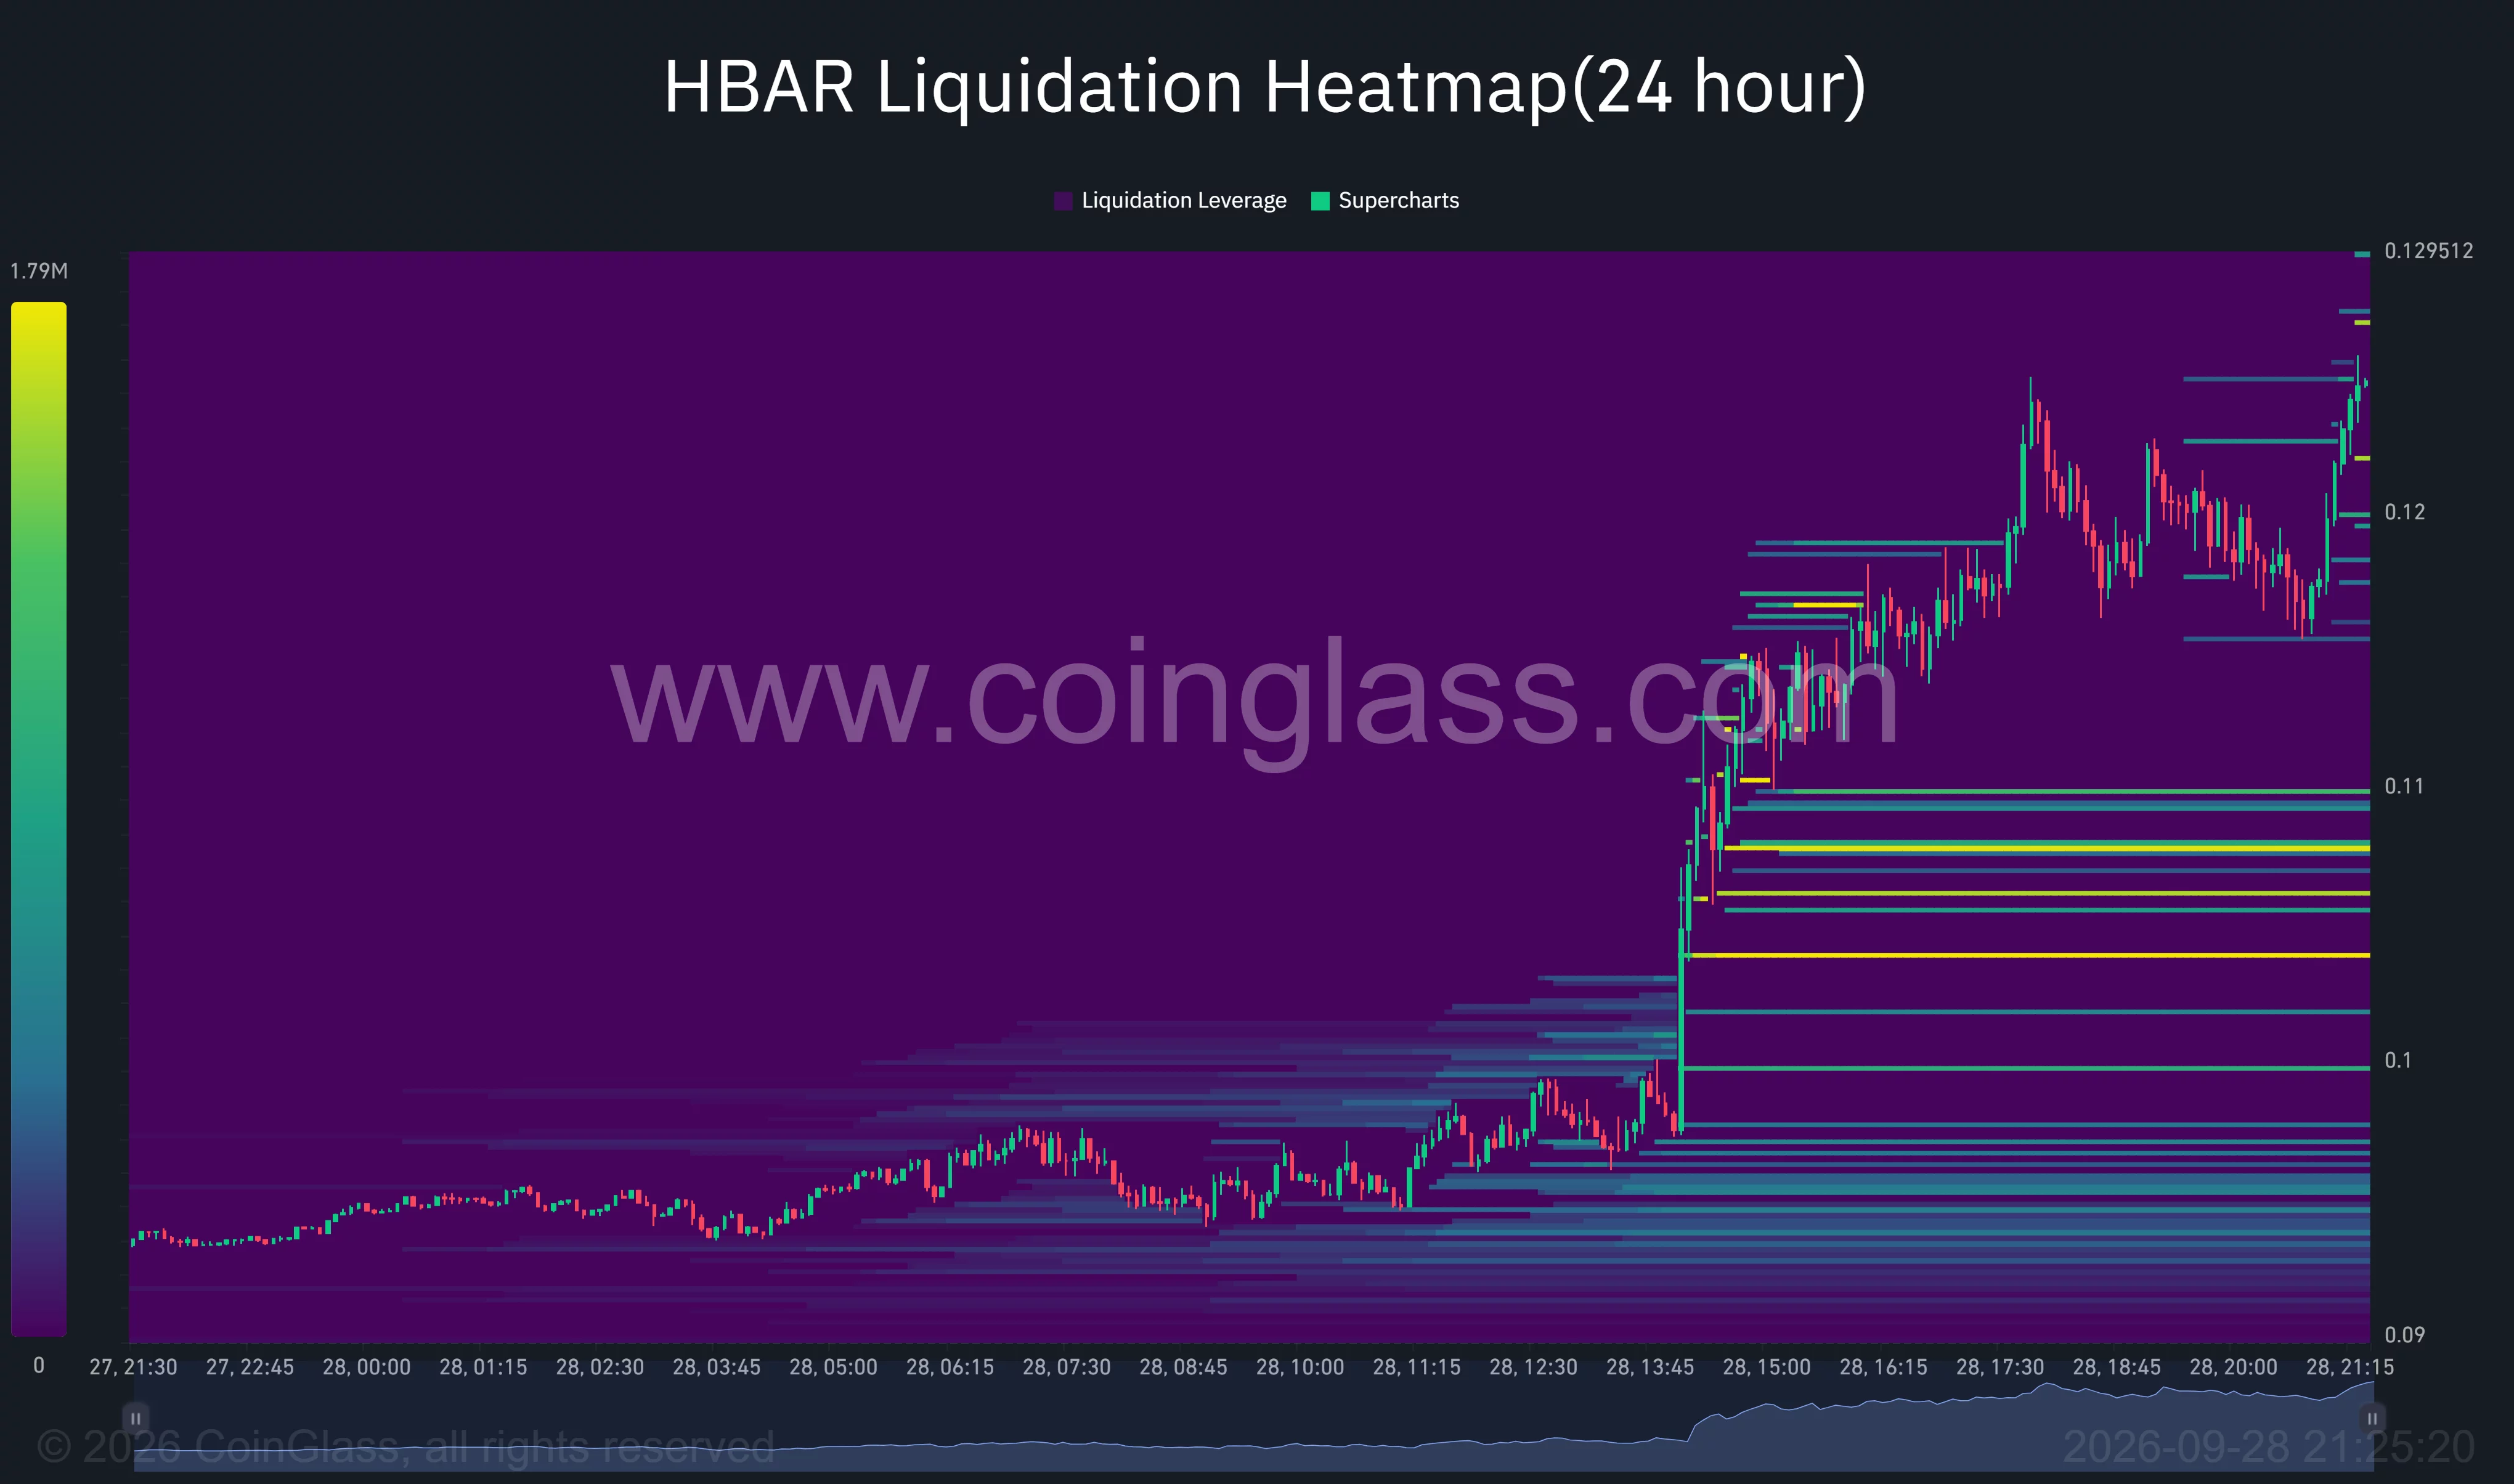
The brightest remaining band below price lies around $0.108. Other visible clusters sit near $0.105 and the $0.10 area. The heatmap maps estimated liquidation exposure at those prices; it does not show that those positions have already been liquidated or establish what caused the rally.
The earlier account of more than $260,000 in long liquidations during one hour requires separate exchange liquidation data. The heatmap itself cannot confirm that figure or show that forced long selling drove the intraday pullback.
For now, HBAR’s trading range is defined by the $0.12576 high and the levels it cleared during the surge. Holding above $0.12207 would keep price near the top of the move, while a break back below $0.11597 would bring the $0.108 liquidation cluster and the former $0.10 resistance area closer into view.