Ethereum Price Prediction: Is $1.8K or $2K More Likely for ETH’s Near Future?
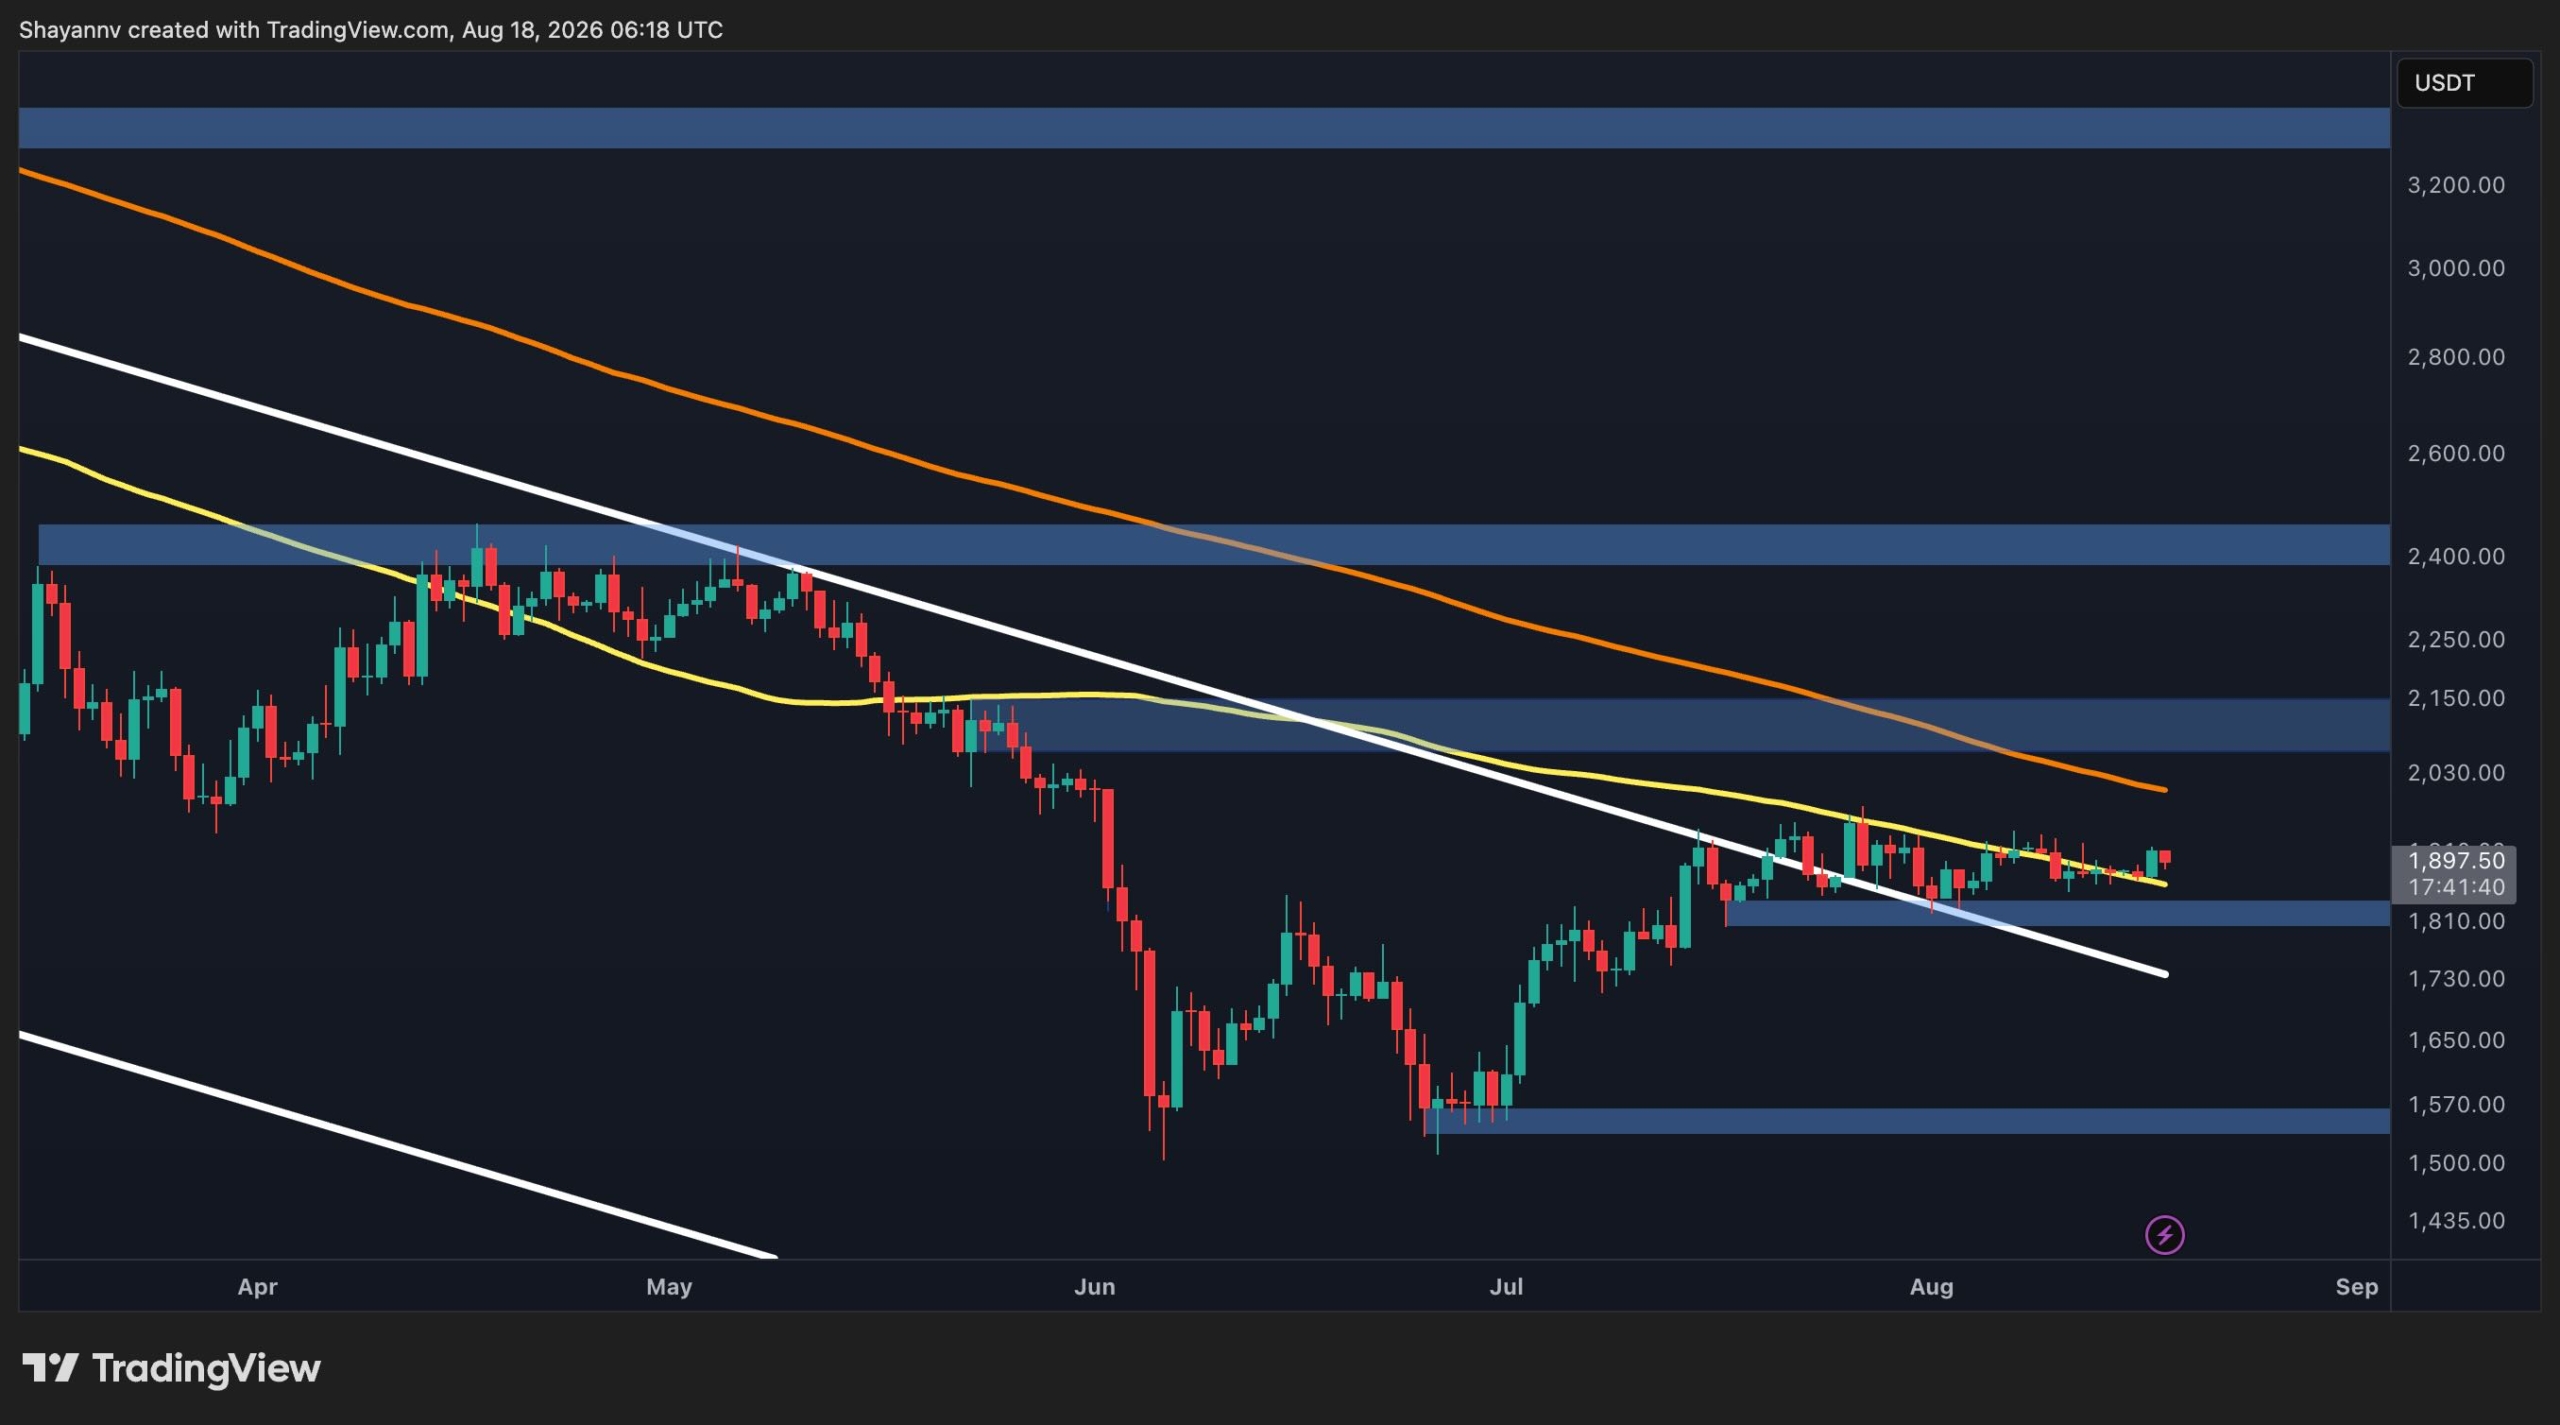
Ethereum is consolidating around $1.9K after recovering sharply from the June and July lows. The broader structure has considerably improved, but ETH still remains below several important resistance levels, and at the moment, the market is at a key decision point.
Ethereum Price Analysis: The Daily Chart
The daily chart shows ETH trading around $1.9K, with the price currently caught between the 1.8K support zone and the $2.1K resistance area. The latter is particularly important because reaching it would mean that the market has broken past both the 100-day and 200-day moving averages and is ready to build a new uptrend.
ETH’s recovery from the $1.55K area has produced a sequence of higher lows and pushed the asset back above the white trendline, which is the upper boundary of the long-term descending channel that has held ETH captive for months. However, the broader trend cannot yet be called completely bullish, as the 200-day moving average remains well above the current price and continues to slope lower around $2K.
Meanwhile, the price has just broken the 100-day moving average, which is just below the $1.85K area, and is flattening, suggesting that momentum has stabilized and that the price is finding a footing to attack the $2K area. A sustained move above $2K would therefore be an important structural improvement, while reclaiming the broader $2.1K zone could open the door toward the 2.4K resistance region.
On the downside, the $1.8K area is the first major support to watch. A daily breakdown below this zone would weaken the recovery structure and could expose the next support zone around $1.55K.
ETH/USDT 4-Hour Chart
The 4-hour chart provides a more constructive short-term picture. ETH has been consolidating inside a broad range, with repeated reactions from the $1.8K area and several attempts to approach the $1.96K resistance zone.
The price is also moving within an ascending channel marked by the yellow trendlines. The upper boundary currently converges with the $2K resistance area, making this the immediate level buyers need to overcome.
Momentum has also cooled following the latest attempt to go higher. The RSI has moved back toward the middle of its range after spending time above 60, suggesting that short-term momentum is currently neutral rather than strongly bullish or bearish.
A clean breakout above $2K could confirm a continuation of the recovery and bring the $2.1K daily resistance zone into focus. Conversely, losing $1.8K would invalidate the immediate range structure and increase the probability of a deeper retracement toward $1.72K, and even below the ascending structure.

Sentiment Analysis
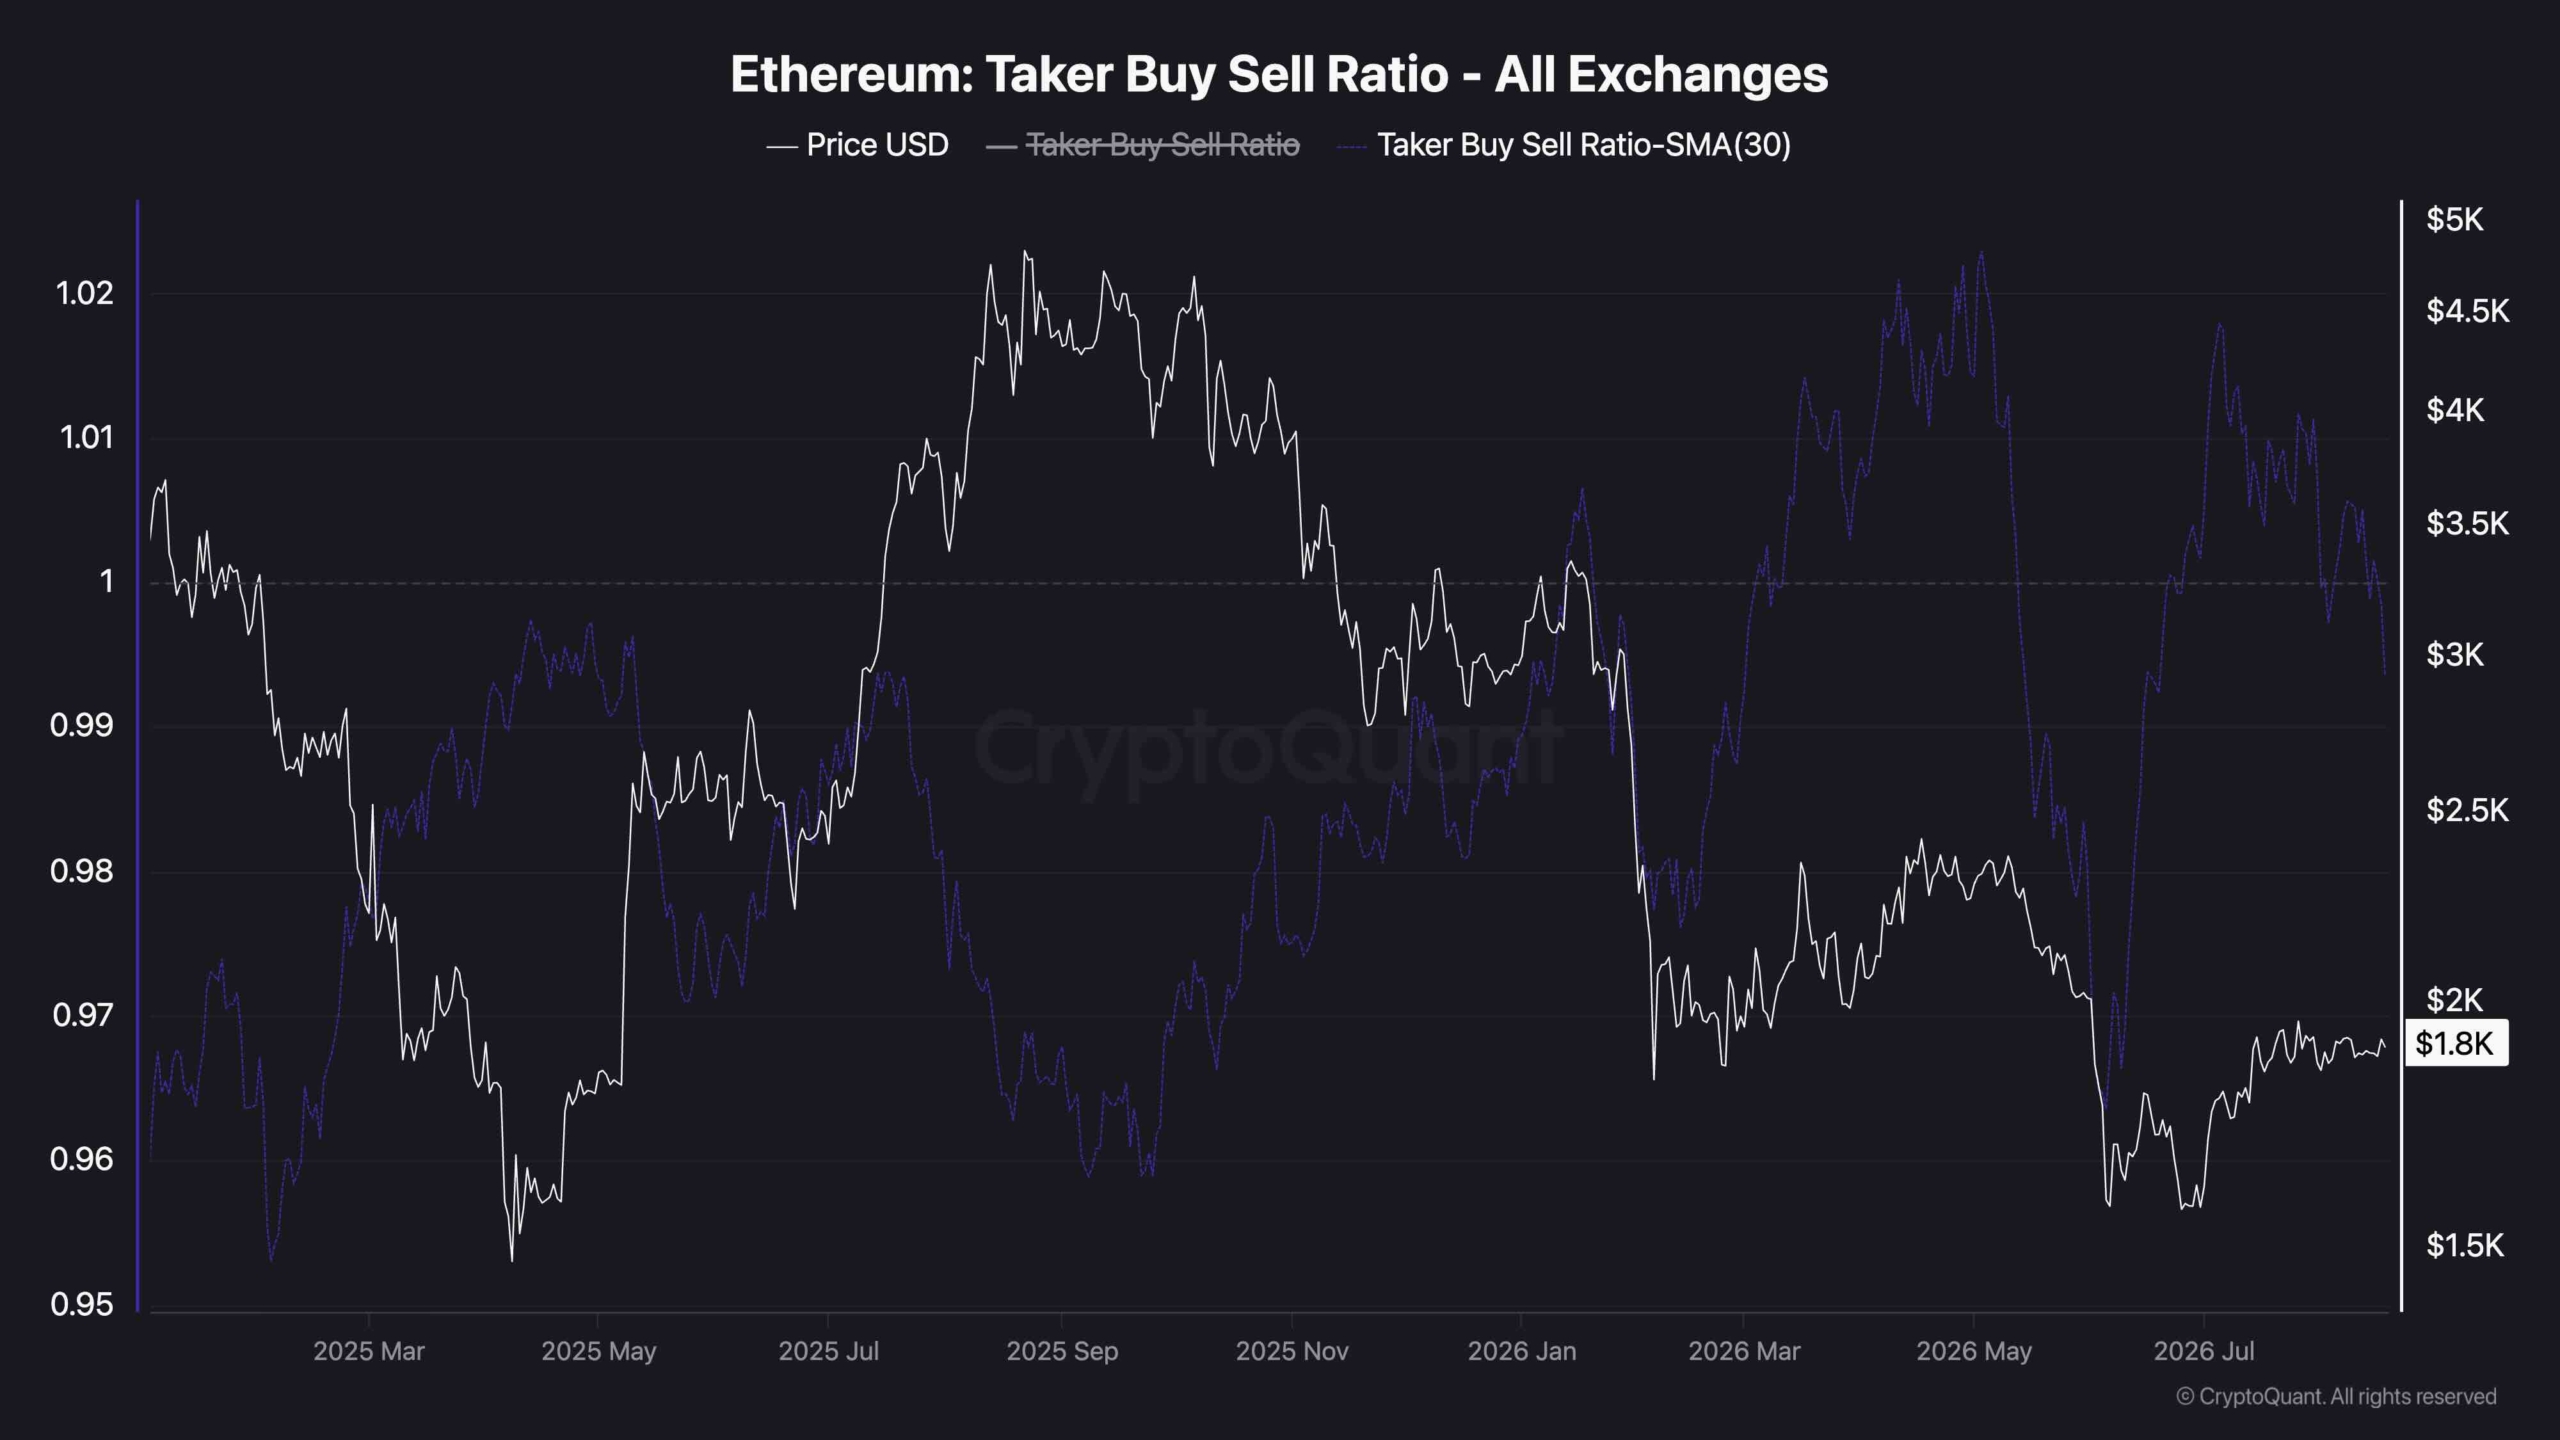
The Ethereum Taker Buy/Sell Ratio chart shows that the 30-period moving average of the ratio has recovered considerably from its lows but remains slightly below the neutral 1 level. A reading below 1 generally indicates that sell-side market orders are still outweighing buy-side market orders.
The improvement in the metric is nevertheless notable. It suggests that aggressive selling pressure has eased compared with earlier periods, broadly coinciding with ETH’s recovery toward $1.9K. However, the ratio has not yet moved decisively above 1, meaning that aggressive buyers have yet to establish clear dominance.
This leaves the on-chain/futures signal cautiously constructive rather than decisively bullish. A sustained move above 1 in the taker buy/sell ratio, alongside a breakout above the $2K resistance area, would provide stronger confirmation that demand is returning. Until then, ETH’s price action remains consistent with consolidation beneath major resistance rather than a confirmed breakout.