Ethereum Price Prediction: $3K Is Still in Play, But ETH Must Clear This Key Hurdle First
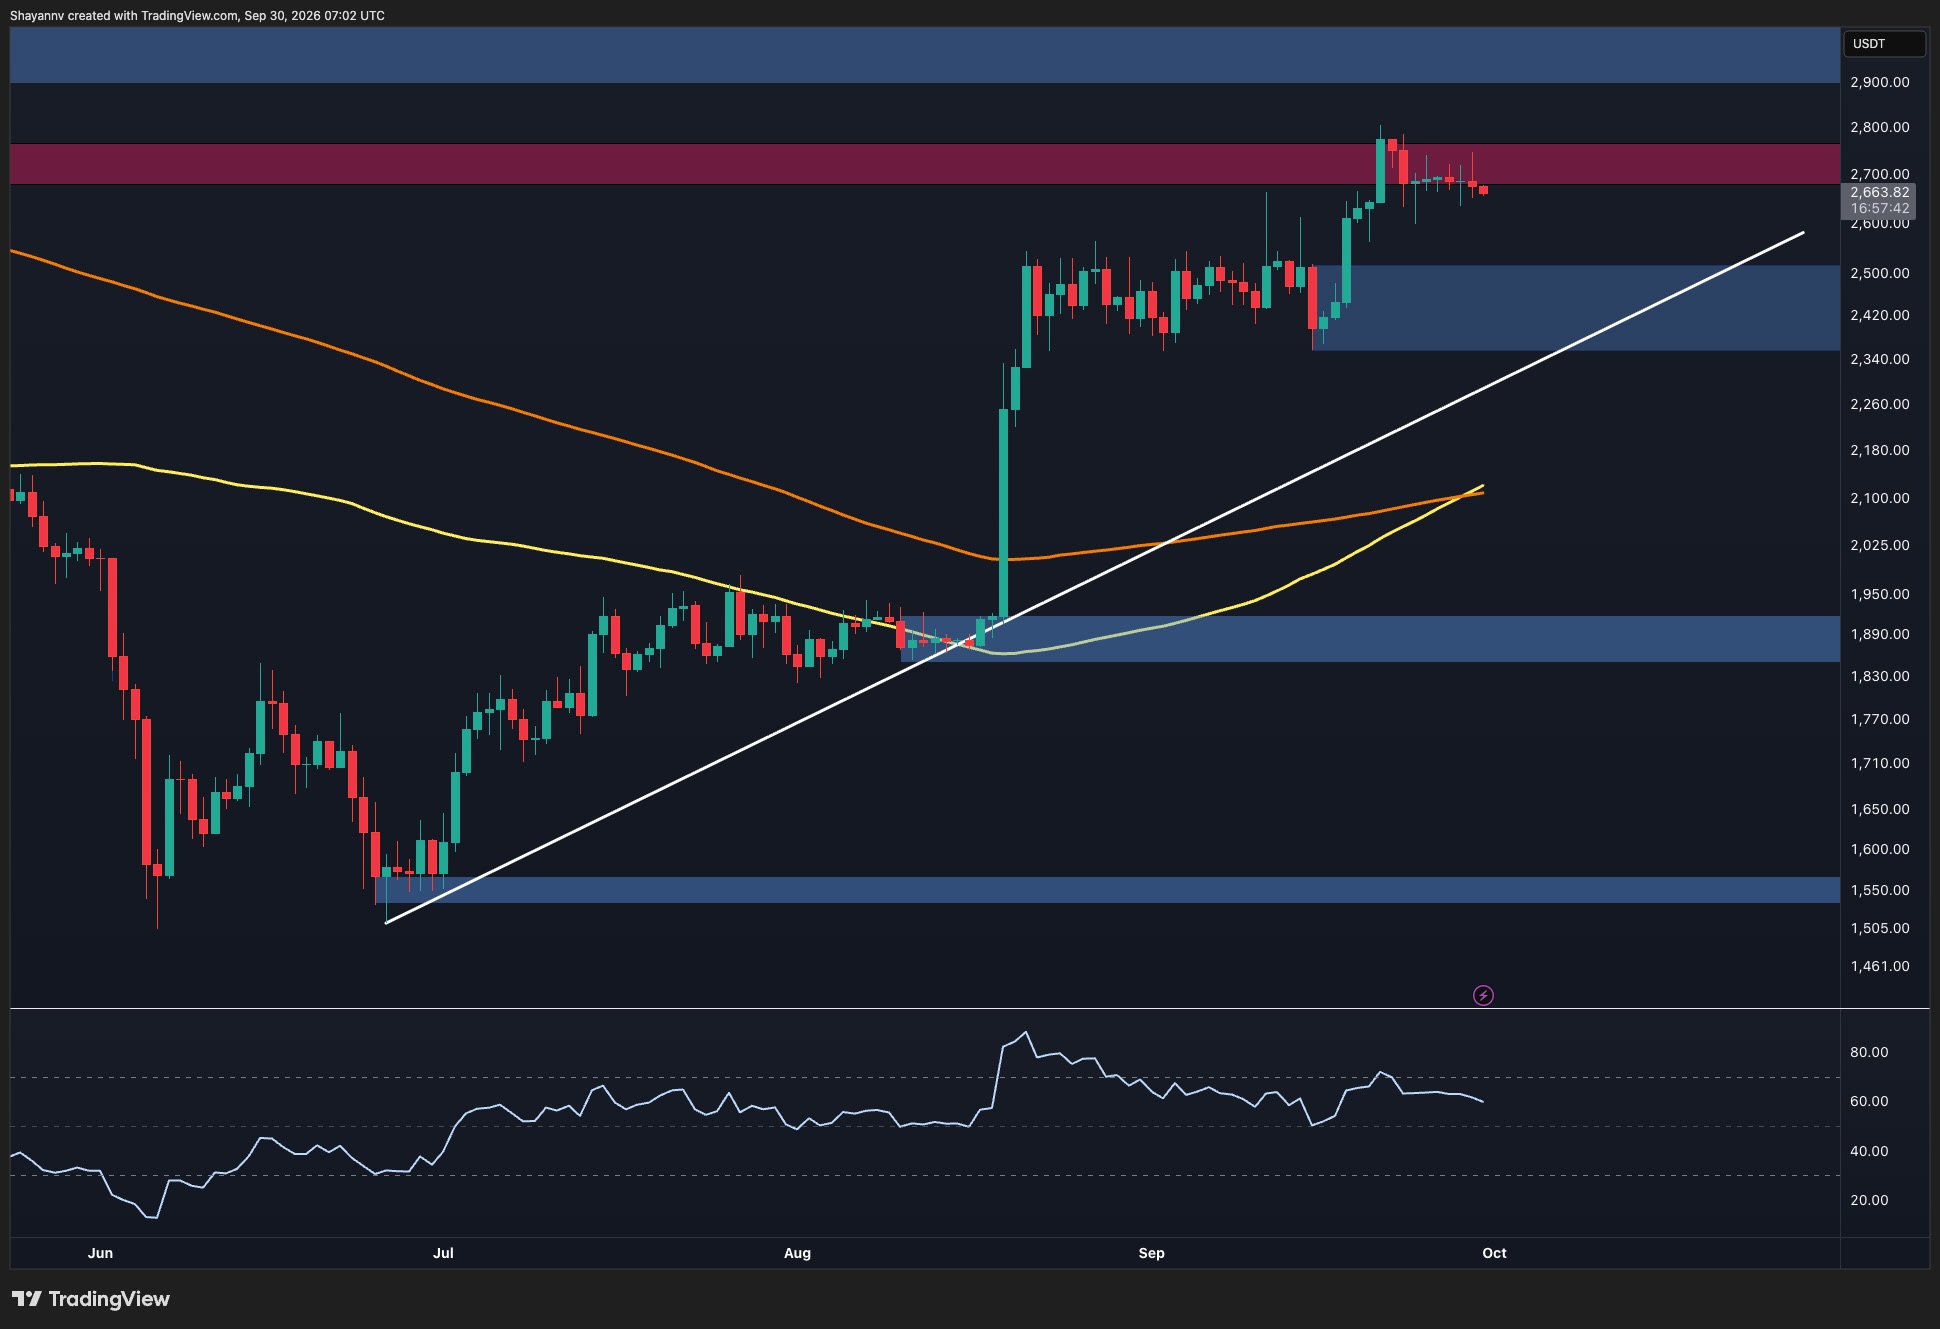
Ethereum’s rally has stalled beneath a key supply zone, with тхе ассет trading slightly above $2.7K as buyers attempt to preserve the recent bullish structure. The broader recovery remains intact, but weakening short-term momentum leaves the market vulnerable to a deeper pullback before another breakout attempt.
Ethereum Price Analysis: The Daily Chart
On the daily timeframe, Ethereum has entered a consolidation phase after its strong advance from the $1.85K–$1.92K support zone. The rally briefly pushed toward $2.8K, but selling pressure around the $2.68K–$2.77K resistance zone prevented a sustained breakout. Recent candles are clustered near the lower boundary of this zone, suggesting that buyers have yet to absorb the overhead supply.
Nevertheless, the broader structure remains constructive. ETH continues to trade above the rising trendline, and both displayed moving averages, with the yellow average crossing above the orange average around $2.1K. This bullish crossover supports the recovery outlook, although the RSI has eased toward 60, indicating that momentum has cooled while remaining above neutral.
A sustained breakout above the $2.77K resistance boundary and the recent $2.8K high could open the way toward the $2.9K–$3K resistance zone. Conversely, continued rejection would bring the $2.35K–$2.51K demand zone into focus, where the rising trendline provides additional technical confluence.
ETH/USDT 4-Hour Chart
The 4-hour chart highlights repeated rejections from the $2.68K–$2.77K supply zone, while an ascending support trendline has helped maintain progressively higher lows. ETH is now testing this trendline around $2.65K–$2.66K after another unsuccessful attempt to sustain a move into resistance.
Holding this support could allow buyers to challenge the $2.72K–$2.77K resistance area again. However, a convincing bullish continuation would require a sustained break above the supply zone and the recent highs near $2.8K.
A decisive break below the ascending trendline would weaken the immediate bullish structure and expose the $2.6K support area, followed by the earlier swing low around $2.56K. If selling pressure extends, the highlighted $2.44K–$2.48K demand zone would become the next important area for buyers to defend.

Sentiment Analysis
The Binance ETH/USDT liquidation heatmap shows substantial estimated liquidation concentrations on both sides of the current price. The most prominent nearby downside band sits around $2.62K, with additional concentrations extending toward $2.55K–$2.6K. Above price, a strong cluster is visible around $2.75K–$2.78K, alongside a broader concentration toward $2.8K.
This positioning places Ethereum between two meaningful liquidation pools. A loss of the 4-hour ascending support could expose the $2.62K cluster, where long liquidations may amplify the decline. Conversely, reclaiming the nearby resistance zone could bring the overhead $2.75K–$2.8K liquidity into play and potentially accelerate an upward move through short liquidations.
The heatmap does not establish which side will be reached first. However, its alignment with the technical levels suggests that a break from the current consolidation could trigger a sharper move as leveraged positions unwind.
