Ethereum price meets resistance: Can $2,575 unlock a rally?

Ethereum price has recovered toward $2,530 after last week’s slide, but resistance around $2,560–$2,575 stands between its rebound and a possible return to $2,700.
- Ethereum price traded near $2,530, below its daily 20-day and 50-day moving averages.
- US spot Ethereum ETFs recorded $542.2 million in net outflows during Oct. 5–9.
- Analysts Ted Pillows and Michaël van de Poppe identified $2,560–$2,575 as an important recovery zone.
- CoinGlass showed large overhead liquidation concentrations near $2,585, $2,635–$2,640, and $2,740.
TradingView’s Binance ETH/USDT daily chart placed Ethereum at $2,529.47 on Oct. 12, following a sharp retreat from the $2,700 region earlier in the month. Ether had rebounded from a low around $2,410 during the sell-off, although the recovery remained below two nearby daily moving averages.
The daily chart recorded a session high of $2,579.88 before ETH slipped back toward $2,530. The move briefly carried Ethereum into the resistance area identified by analysts, but the price had not held above that zone.
Ethereum faces resistance between $2,558 and $2,640
On TradingView’s daily chart, Ethereum’s 50-day simple moving average stood at $2,558.10, roughly 1.1% above the displayed price. The 20-day average was higher at $2,640.41, placing a second technical hurdle above the immediate resistance band.
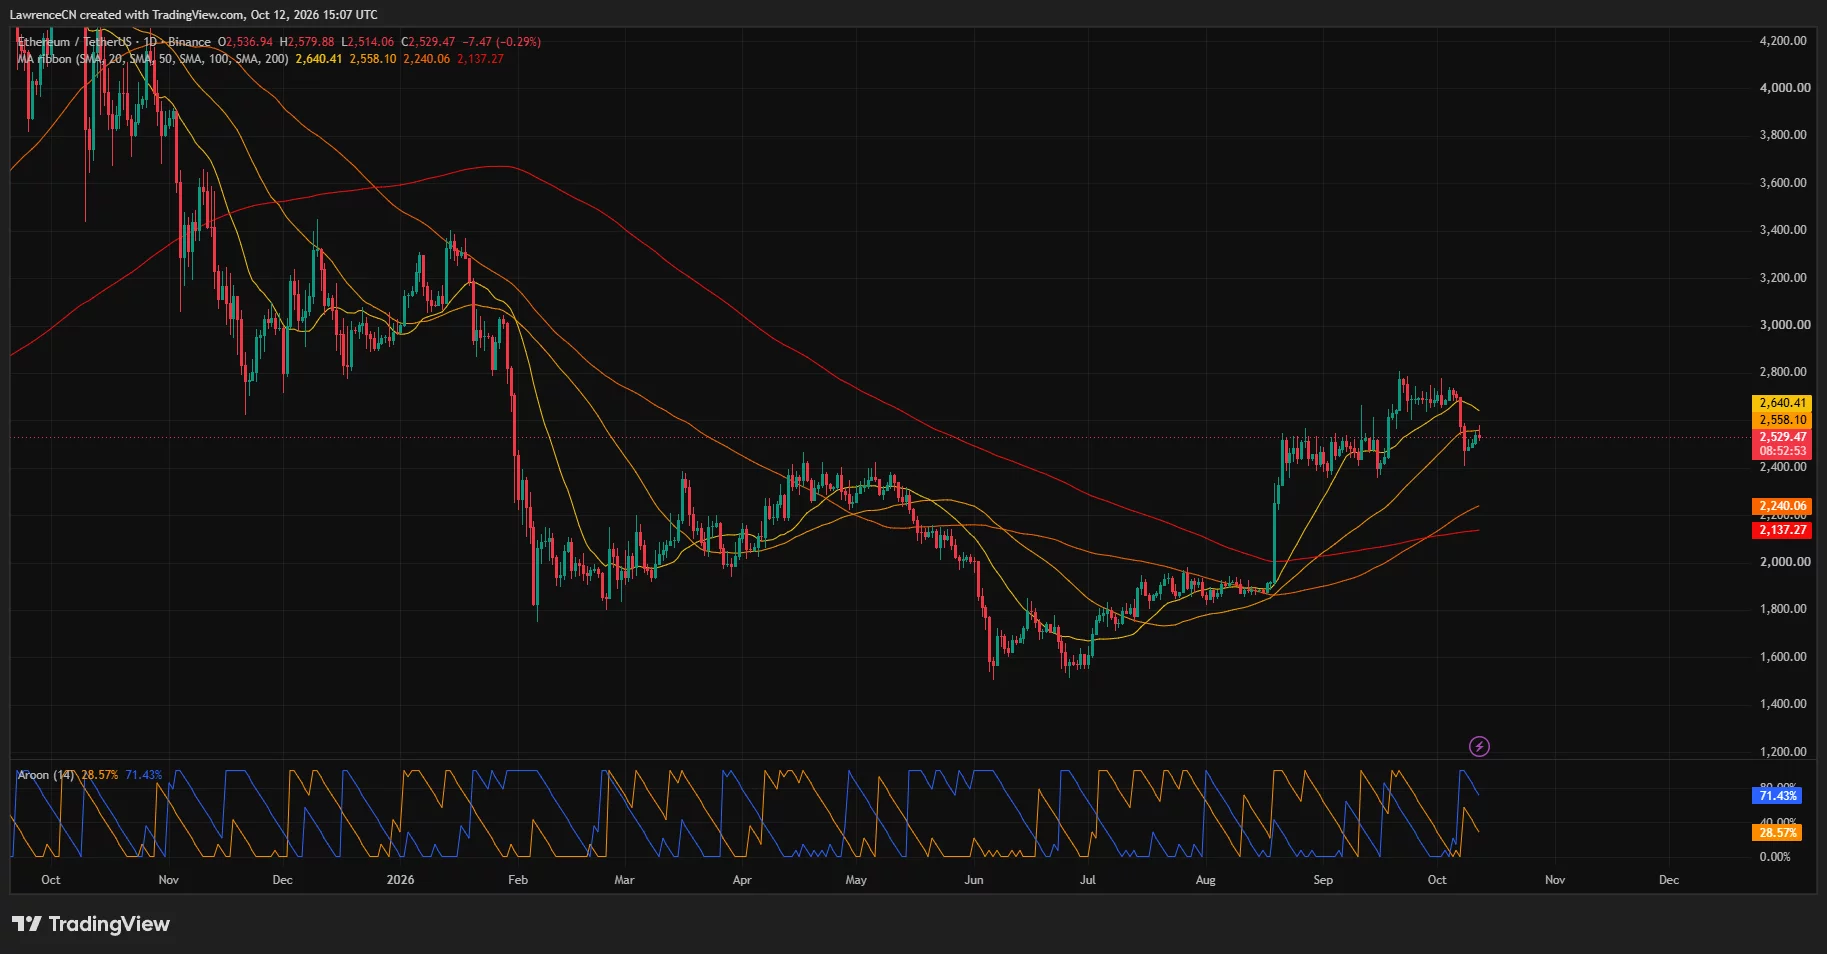
Ethereum’s retreat below both averages followed its failure to sustain the late-September advance toward $2,800. The latest rebound had brought the price back toward the 50-day line, while the shorter 20-day average remained above it.
The daily chart also showed Ethereum trading above its 100-day moving average at $2,240.06 and its 200-day average at $2,137.27. Those longer averages sit well beneath the recent trading range, with the nearer $2,500 and $2,400 areas coming first on the downside.
The Aroon indicator showed its down line at 71.43% and its up line at 28.57%. The higher down reading reflected the more recent prominence of a daily low within the indicator’s lookback period, despite Ethereum’s bounce from last week’s trough.
For an upside recovery, the daily chart places the first moving-average barrier near $2,558, followed by $2,640. Beyond those levels, the recent trading area around $2,700 and the September peak near $2,800 remain overhead reference points.
The 4-hour rebound loses strength below $2,560
TradingView’s 4-hour chart placed ETH at $2,526.68, above the Bollinger Bands’ middle line at $2,513.88. The upper band stood at $2,559.97, while the lower band was at $2,467.78.
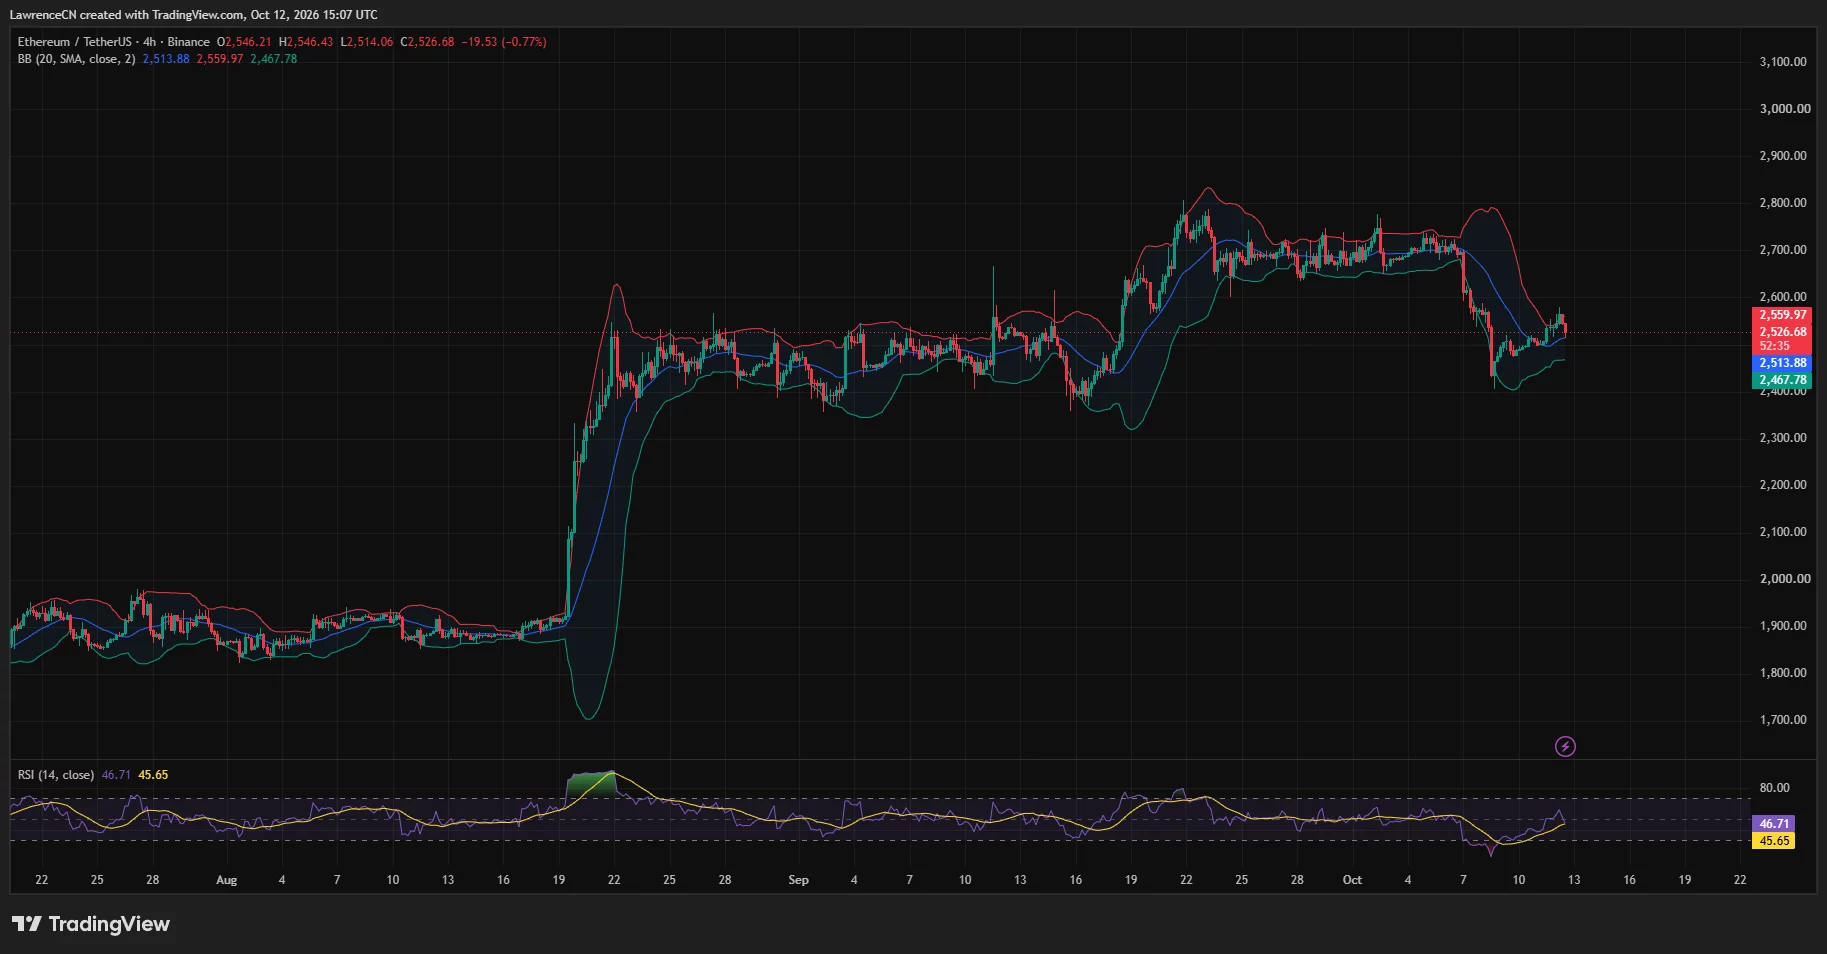
The upper band closely matched the daily 50-day moving average, putting two separate technical readings around $2,558–$2,560. Ethereum’s rebound approached that area before pulling back toward the middle of the bands.
The 4-hour relative strength index stood at 46.71, compared with its smoothing average of 45.65. RSI had recovered from the oversold region reached during the sell-off, but remained below the neutral 50 mark.
Price action on the same chart showed Ethereum rebuilding from approximately $2,410, consolidating around $2,480–$2,510 and then advancing toward $2,570. The subsequent retreat left ETH above the Bollinger middle line but below the upper band.
The nearby downside references are therefore $2,514 and the psychological $2,500 level, followed by the lower band around $2,468. A deeper decline would bring the recent low near $2,410 and the $2,400 area back into focus.
Analysts put the recovery threshold near $2,575
Analyst Ted Pillows identified $2,560–$2,570 as Ethereum’s immediate resistance zone in an Oct. 12 post. He said reclaiming that range could open the way for a rally toward $2,700.
His assessment followed an earlier move above $2,550. The later TradingView readings near $2,530 showed Ethereum had pulled back below that level after testing higher prices.
Michaël van de Poppe set a slightly higher threshold in an Oct. 11 post, saying he wanted to see a strong breakout above $2,575. He described Ethereum as remaining beneath important resistance and said more strength was needed.
I'd prefer to see a strong breakout above $2,575 for $ETH.
— Michaël van de Poppe (@CryptoMichNL) October 11, 2026
It's currently remaining quite calm and under critical resistances.
Overall, my expectations are that this will outperform #Bitcoin for the coming period, but we need to see a little bit more strength. pic.twitter.com/mKOfKAMwx8
Van de Poppe also said he expected Ethereum to outperform Bitcoin in the coming period. His outlook remained a forecast, with a stronger ETH breakout forming part of the confirmation he wanted to see.
Together, the analysts’ levels place the immediate recovery test between $2,560 and $2,575. Ted Pillows’ $2,700 scenario depends on Ethereum reclaiming resistance, while the latest chart readings show that test remains unresolved.
ETF withdrawals accompany overhead liquidation clusters
Farside Investors recorded $542.2 million in net withdrawals from US spot Ethereum ETFs during Oct. 5–9. Its daily figures showed nine consecutive negative sessions from Sep. 29 through Oct. 9, totaling $697.4 million.
The largest withdrawal last week came on Oct. 6, when the funds lost $201.9 million, entirely from BlackRock’s ETHA. Another $160.9 million left on Oct. 7, followed by $72.5 million on Oct. 8 and $56.1 million on Oct. 9, according to Farside.
CoinGlass’s one-week liquidation heatmap showed several concentrated bands above Ethereum’s latest price. Prominent areas appeared near $2,585 and $2,635–$2,640, with another large concentration around $2,740.
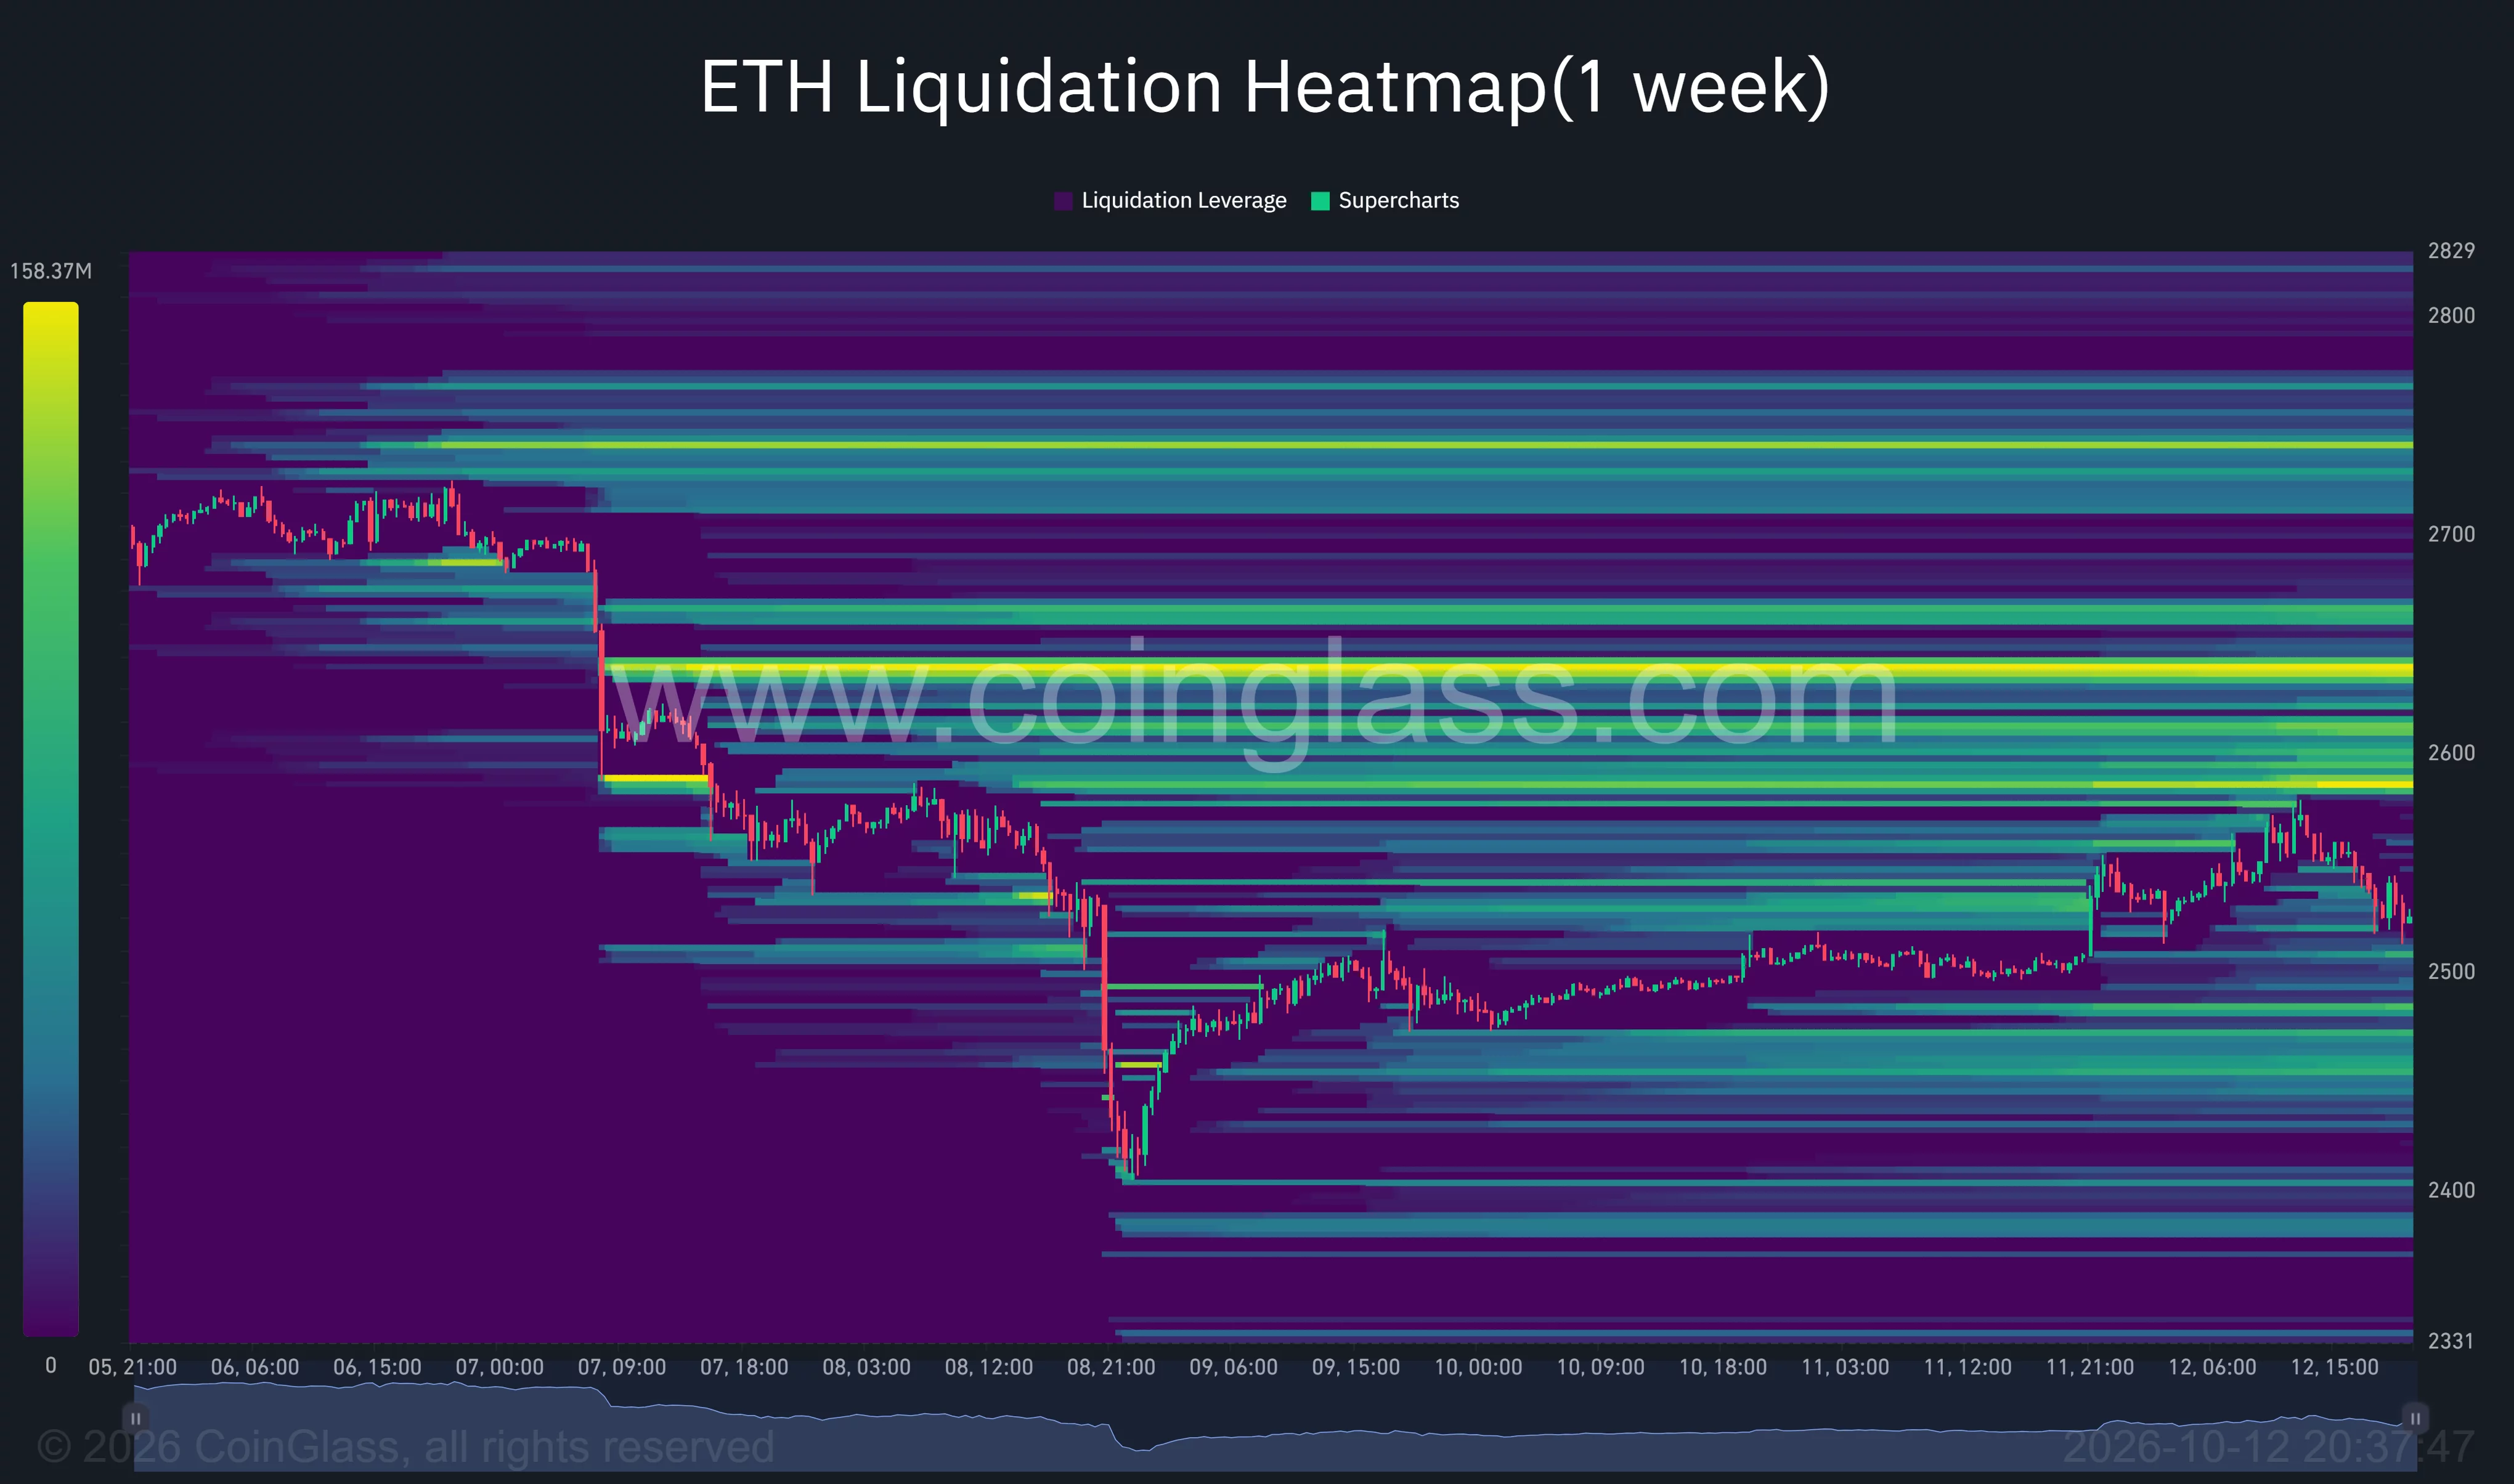
The closest of those bands sits just above the $2,560–$2,575 resistance range identified by the analysts. The concentration near $2,640 also aligns closely with Ethereum’s daily 20-day moving average.
Below the market, CoinGlass showed liquidation bands around $2,480, $2,450–$2,470, and $2,400. Ethereum’s recent trough reached the lower end of that structure before the rebound.
Ethereum now trades between nearby support around $2,500 and resistance around $2,560–$2,575. The daily moving averages, 4-hour Bollinger Bands, and analysts’ stated thresholds all place the first recovery hurdle within a narrow range above the latest price.