Bitcoin price slips below $63K as whale builds $125M short

Bitcoin price has fallen 2% from $63,895 to an intraday low of $62,667 on Aug. 14 as spot selling, a $125 million whale short, and weak derivatives demand pushed the price toward a key support zone.
- Bitcoin price fell below $63,000 and approached its lower daily Bollinger Band at $62,507.
- A whale increased a Bitcoin short to 1,900 BTC, worth about $125 million.
- The 4-hour Supertrend remains bearish, while the Chaikin Money Flow stands at -0.08.
- Liquidation clusters sit near $62,200 below the price and between $64,000 and $64,700 above it.
Bitcoin price action today points to seller control
According to data from crypto.news, Bitcoin (BTC) price was trading near $62,772 at the time of writing, down 1.13% since the daily open at $63,491. The price had reached a session high of $63,617 before falling as low as $62,700 on Binance.
Measured from an earlier intraday level of $63,895 to the low near $62,667, the decline reached roughly 2%. The move broke the psychological $63,000 level and placed Bitcoin just above the lower daily Bollinger Band at $62,507.
Bitcoin has remained trapped in a relatively narrow range since early July, with buyers repeatedly appearing near $62,000 and sellers limiting rallies between $65,000 and $66,000. The latest decline followed another rejection from the upper part of that range, extending a series of lower highs visible since the July 21 peak near $66,700.
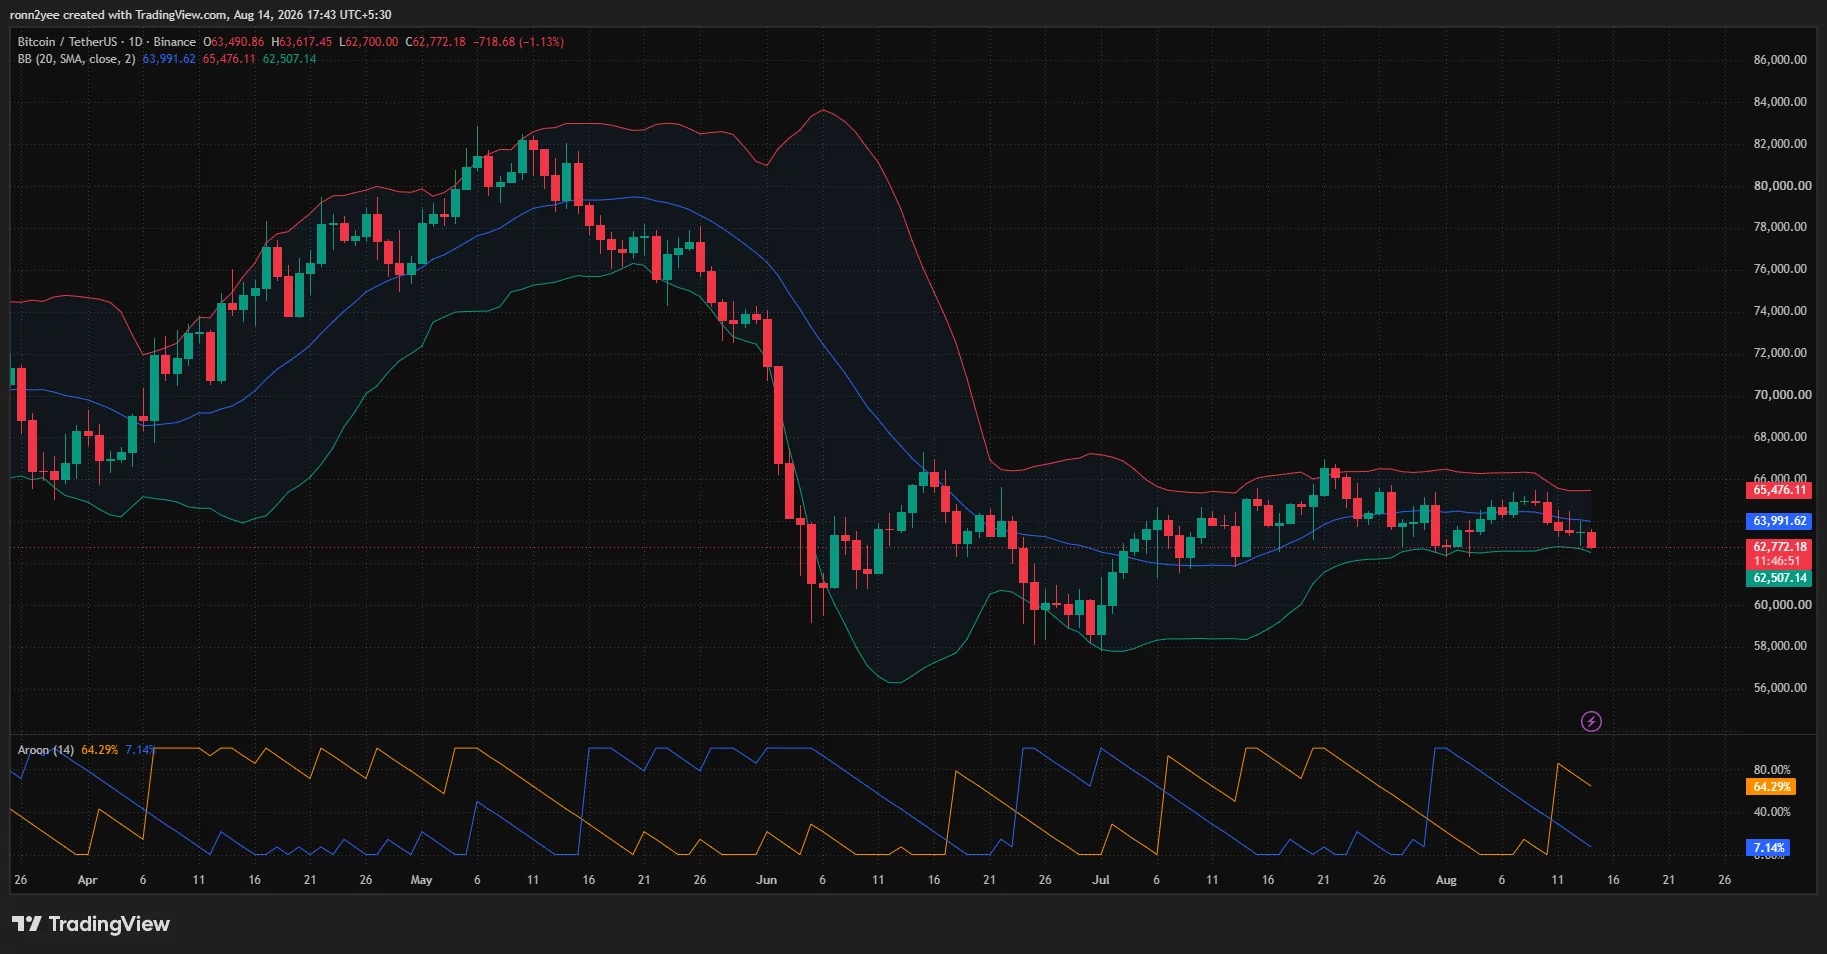
The daily Bollinger Band midpoint now stands at $63,992. Trading below that level places the immediate advantage with sellers, while the upper band at $65,476 defines the next major resistance area if buyers recover.
Aroon data also showed a bearish imbalance. The Aroon Down reading stood at 64.29%, compared with an Aroon Up reading of 7.14%, indicating that a recent low carries more weight than any recent high.
What is driving the Bitcoin decline?
On-chain analyst Ai Yi reported that a large trader added 258 BTC to an existing short position, lifting the trade to 1,900 BTC with an average entry price of $63,582. The position was worth about $125 million and carried an unrealized profit of approximately $1.79 million at the time of the update.
The short does not prove that one trader caused the entire decline. However, the position added to bearish derivatives exposure while Bitcoin was already losing short-term support. Selling below $63,000 then placed pressure on leveraged buyers whose trades depended on the level holding.
Institutional demand has also weakened. According to data from SoSoValue, U.S. spot Bitcoin exchange-traded funds recorded two consecutive sessions of net withdrawals totaling $192 million. Reduced ETF demand removed one source of buying that could absorb coins sold during volatile sessions.
Strategy added to the cautious mood earlier in the week when it disclosed the sale of 1,690 BTC for nearly $109 million. The company used the proceeds to repurchase preferred stock after going seven weeks without adding Bitcoin to its treasury. The disposal was Strategy’s fourth Bitcoin sale since June.
Outside crypto, higher oil prices and elevated bond yields kept pressure on risk assets. Brent crude traded above $87 as tensions around Iran and the Strait of Hormuz raised concerns about energy supplies, while the 10-year U.S. Treasury yield remained near 4.66%. Higher Treasury yields can reduce demand for assets such as Bitcoin because government debt offers investors a yield without the same level of price volatility.
Softer U.S. wholesale inflation provided limited support. July’s headline Producer Price Index was unchanged, while core PPI increased 0.2%, according to Charles Schwab. Bitcoin still lagged U.S. equities, showing that crypto-specific selling and weak market liquidity outweighed the immediate benefit of the inflation data.
Bitcoin faces support at $62,200–$62,500
The 4-hour chart confirmed that short-term momentum remains bearish. Bitcoin traded below the 4-hour Supertrend level at $64,094, which has acted as resistance since the price lost the indicator on Aug. 10.
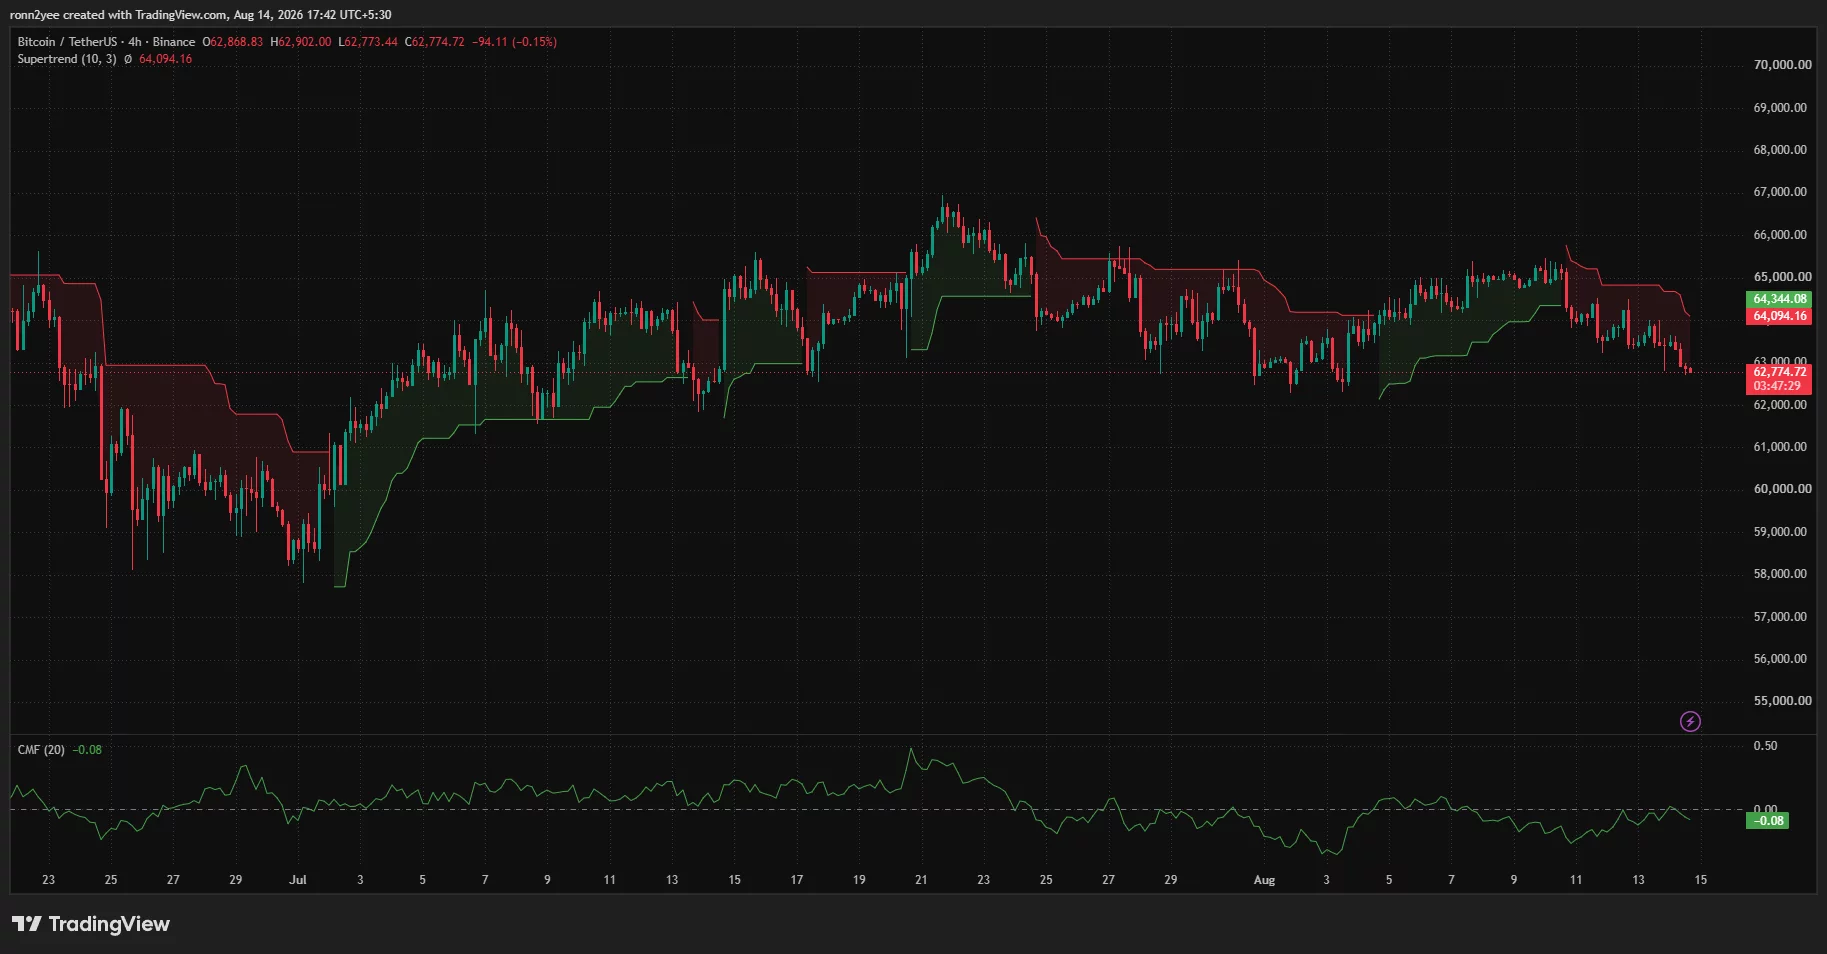
Chaikin Money Flow stood at -0.08 on the same timeframe. A reading below zero indicates that selling volume has outweighed buying volume over the indicator’s 20-period window, supporting the weakness shown by the price.
Immediate support sits between $62,500 and $62,700, combining the daily lower Bollinger Band with the latest intraday low. A close below that region would place $62,200–$62,300 in focus, followed by the round-number support at $62,000.
The one-week CoinGlass liquidation heatmap showed a concentration of leveraged positions around $62,200. A fall into that area could trigger another group of long liquidations, although the same liquidity zone may attract buyers after leveraged positions are cleared.
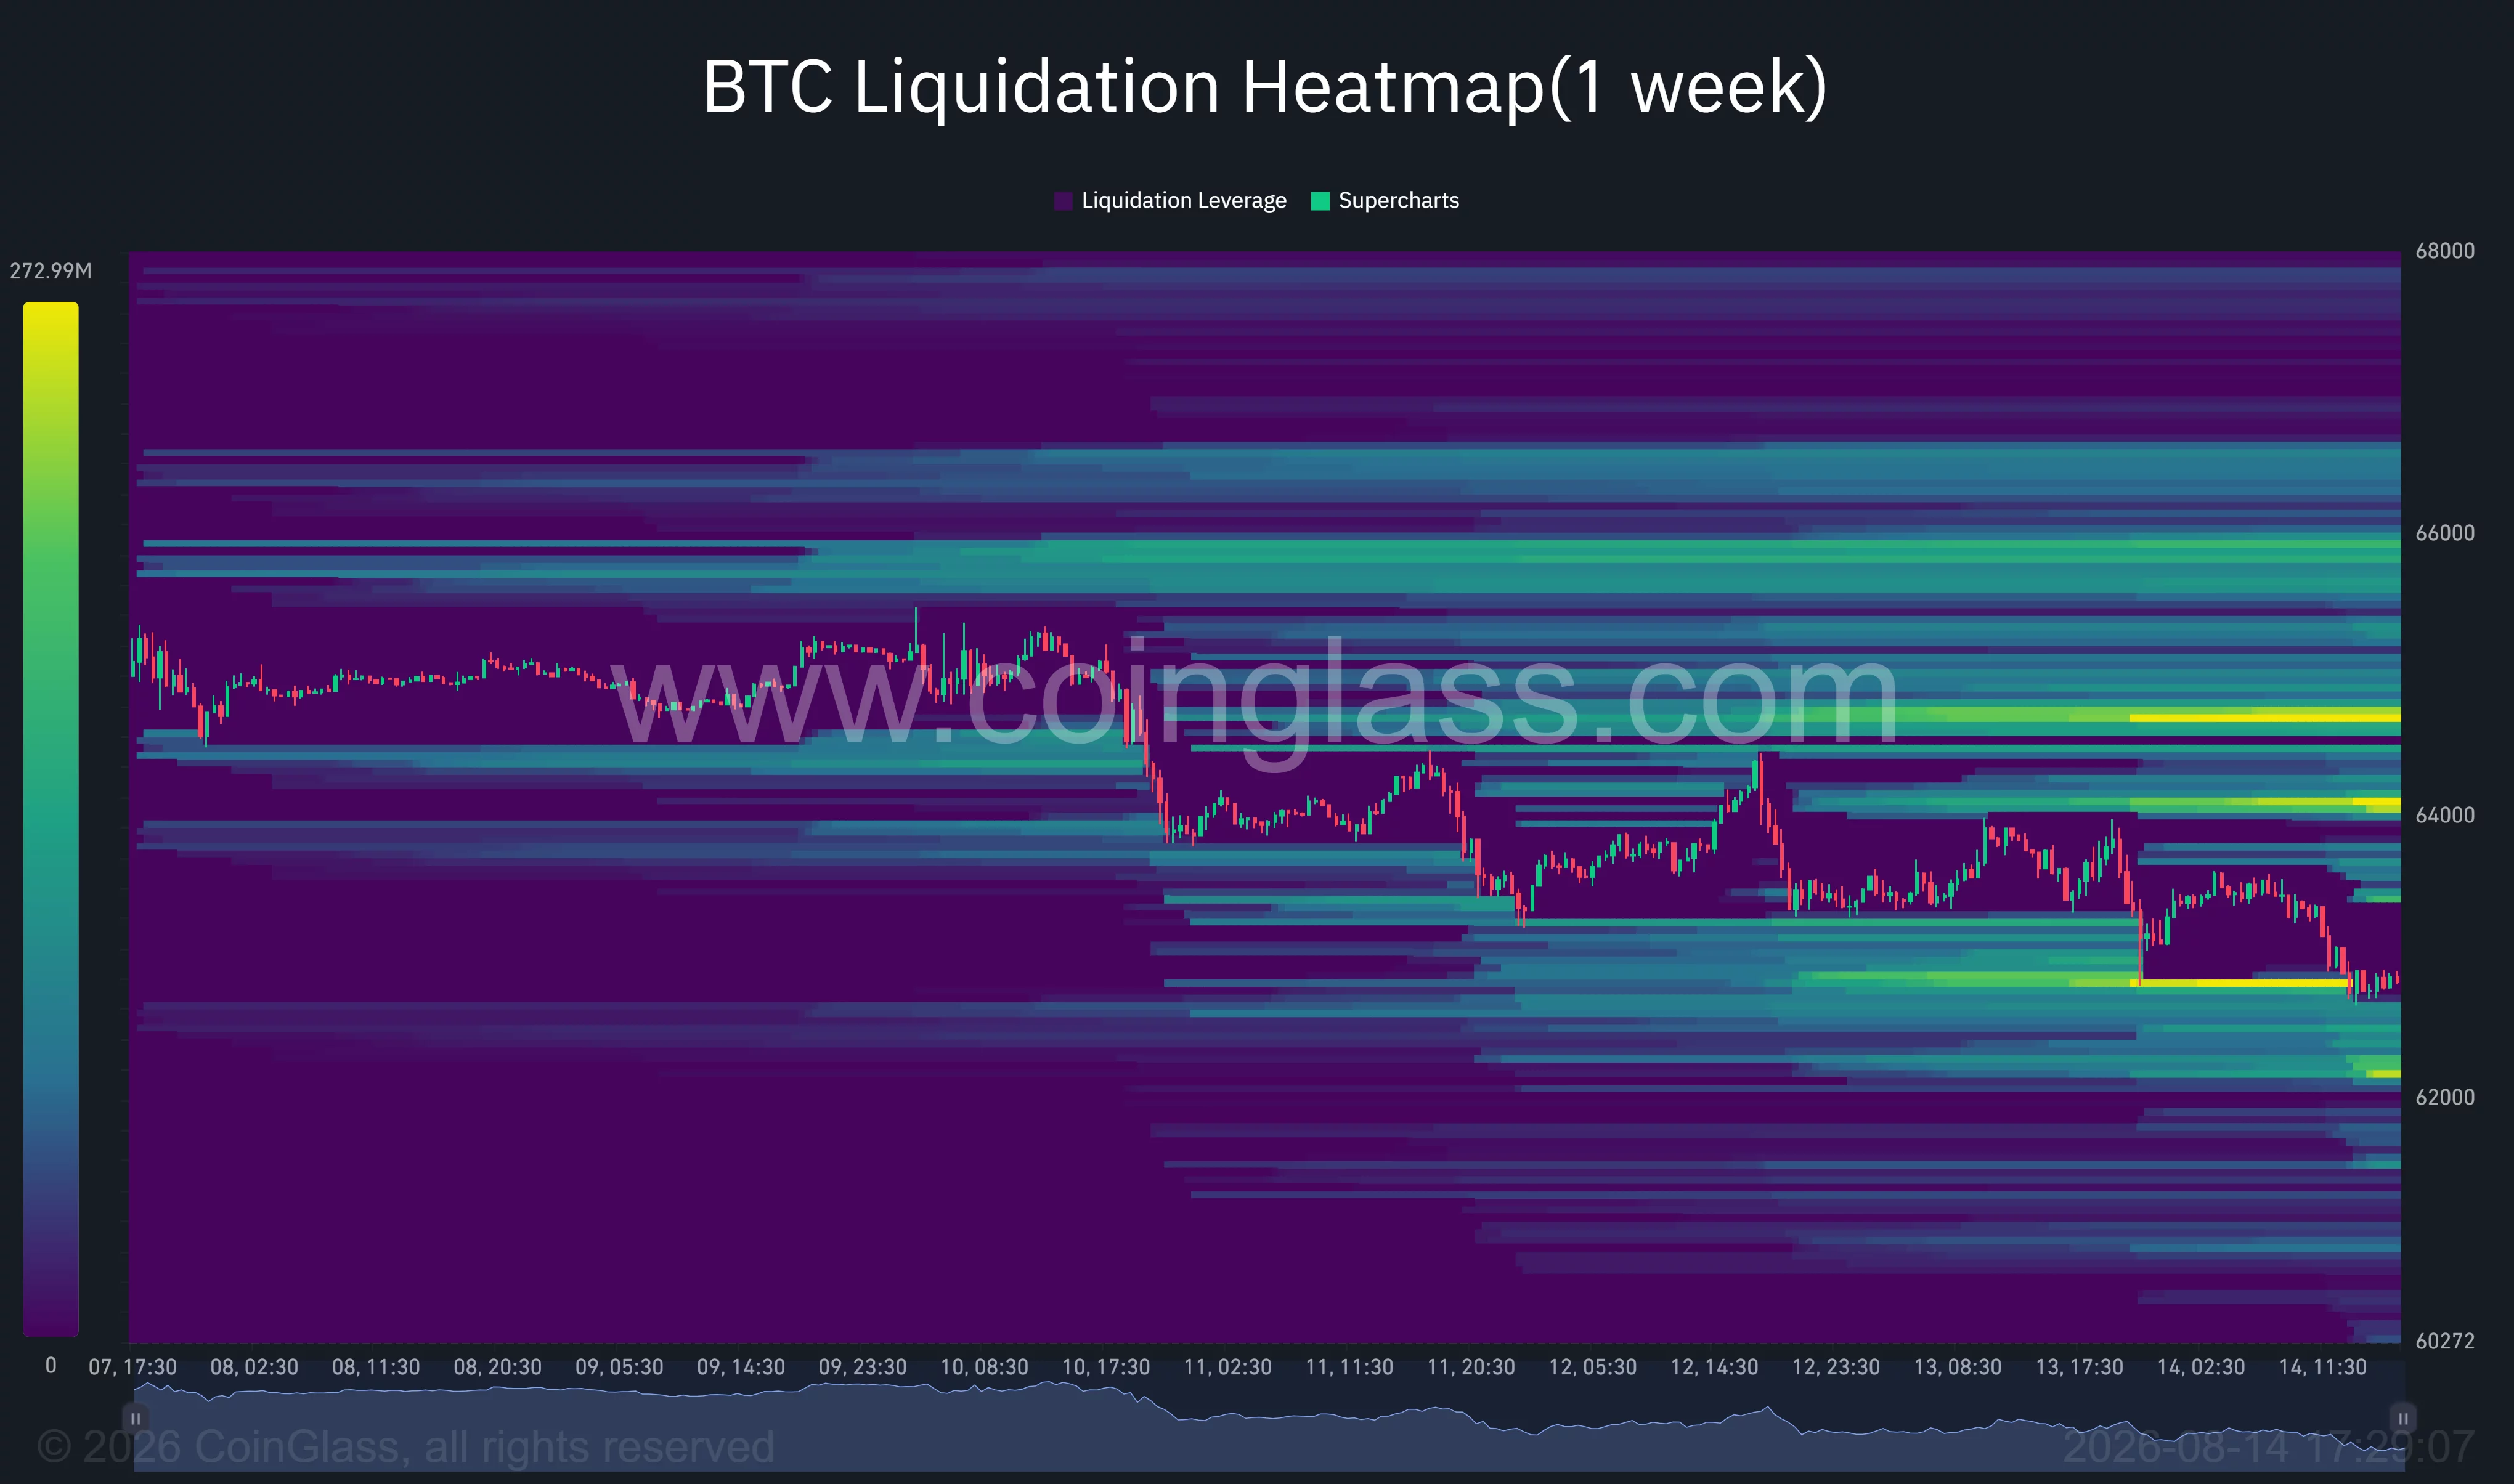
Below $62,000, the next visible liquidity bands appear near $61,500 and $60,300. The lower level also sits close to the bottom of the wider range that formed after Bitcoin’s sharp decline in early June.
For a recovery, Bitcoin must first reclaim $63,500–$64,100. The range includes the whale’s average short entry, the daily Bollinger midpoint, and the 4-hour Supertrend resistance.
A sustained break above $64,100 could expose short positions and pull the price toward liquidation clusters at $64,500–$64,700. Additional liquidity appears near $65,700–$66,000, close to the upper daily Bollinger Band and several previous August highs.
Analysts see $61,500 if the trendline fails
Crypto analyst Gerla said Bitcoin remained compressed inside a multi-week triangle formed by lower highs and a rising support line. According to the analyst, recovering $63,500–$64,000 would bring $65,000 back into play, while losing the lower trendline could send the price toward $61,500.
Gerla leaned toward a downside break because the trading range was tightening while volume declined. Lower volume near the apex of a triangle often precedes a larger move, but the pattern does not determine which side will break first.
Analyst Lennaert Snyder separately said Bitcoin had broken below a $63,900 momentum level and was testing the previous day’s low around $62,800. Snyder identified the prior weekly low near $62,300 as the next downside target if $62,800 fails.
$BTC shows bearish momentum this Friday.
— Lennaert Snyder (@LennaertSnyder) August 14, 2026
Given that DXY is weak, and Bitcoin is dumping too, tells a lot about the current weakness.
We broke below the 63.9K momentum line, and stabbing the 62.8K PDL could complement that.
I didn't get my long trigger at 63K, and I'm not eager… pic.twitter.com/ecuD14biBi
Snyder also noted that the U.S. Dollar Index was weak while Bitcoin continued to fall. Because a weaker dollar can normally support dollar-denominated risk assets, Bitcoin’s inability to benefit indicated weak demand within the crypto market, according to the analyst.
Weekend trading adds another risk in both directions. Thinner order books can make Bitcoin more sensitive to large trades, potentially allowing a move through $62,200 or $64,100 to travel quickly toward the next liquidation cluster.