Bitcoin price outlook: Where is BTC headed this October?

Bitcoin price has recovered toward $83,000 after testing $80,400, but weakening daily momentum and a still-positive weekly breakout leave its October outlook dependent on holding the $79,600–$80,400 support zone.
- $79,663 marks daily Supertrend support beneath Bitcoin’s rebound toward $83,000.
- Daily MACD remains bearish, with its histogram falling to approximately negative 537.
- Bitcoin’s weekly chart remains above the upper boundary of a falling wedge.
- The liquidation heatmap shows a large concentration of leveraged positions near $87,000.
TradingView’s Binance BTC/USDT daily chart placed Bitcoin at $83,012 on Oct. 9, while the weekly chart showed $82,928. The weekly price was down 4.16%, following a high of $86,999 and a low of $80,394.
Bitcoin’s recovery has therefore reduced the distance from its recent highs without reversing the weekly decline. The charts present competing signals for the rest of October: short-term momentum has deteriorated, while the broader recovery from the summer lows remains intact.
Bitcoin’s $80,000 support faces its next test
On the daily TradingView chart, Bitcoin remained above its green Supertrend line at $79,663.52. The indicator still supports a bullish trend reading, although the recent decline has brought price closer to that threshold.
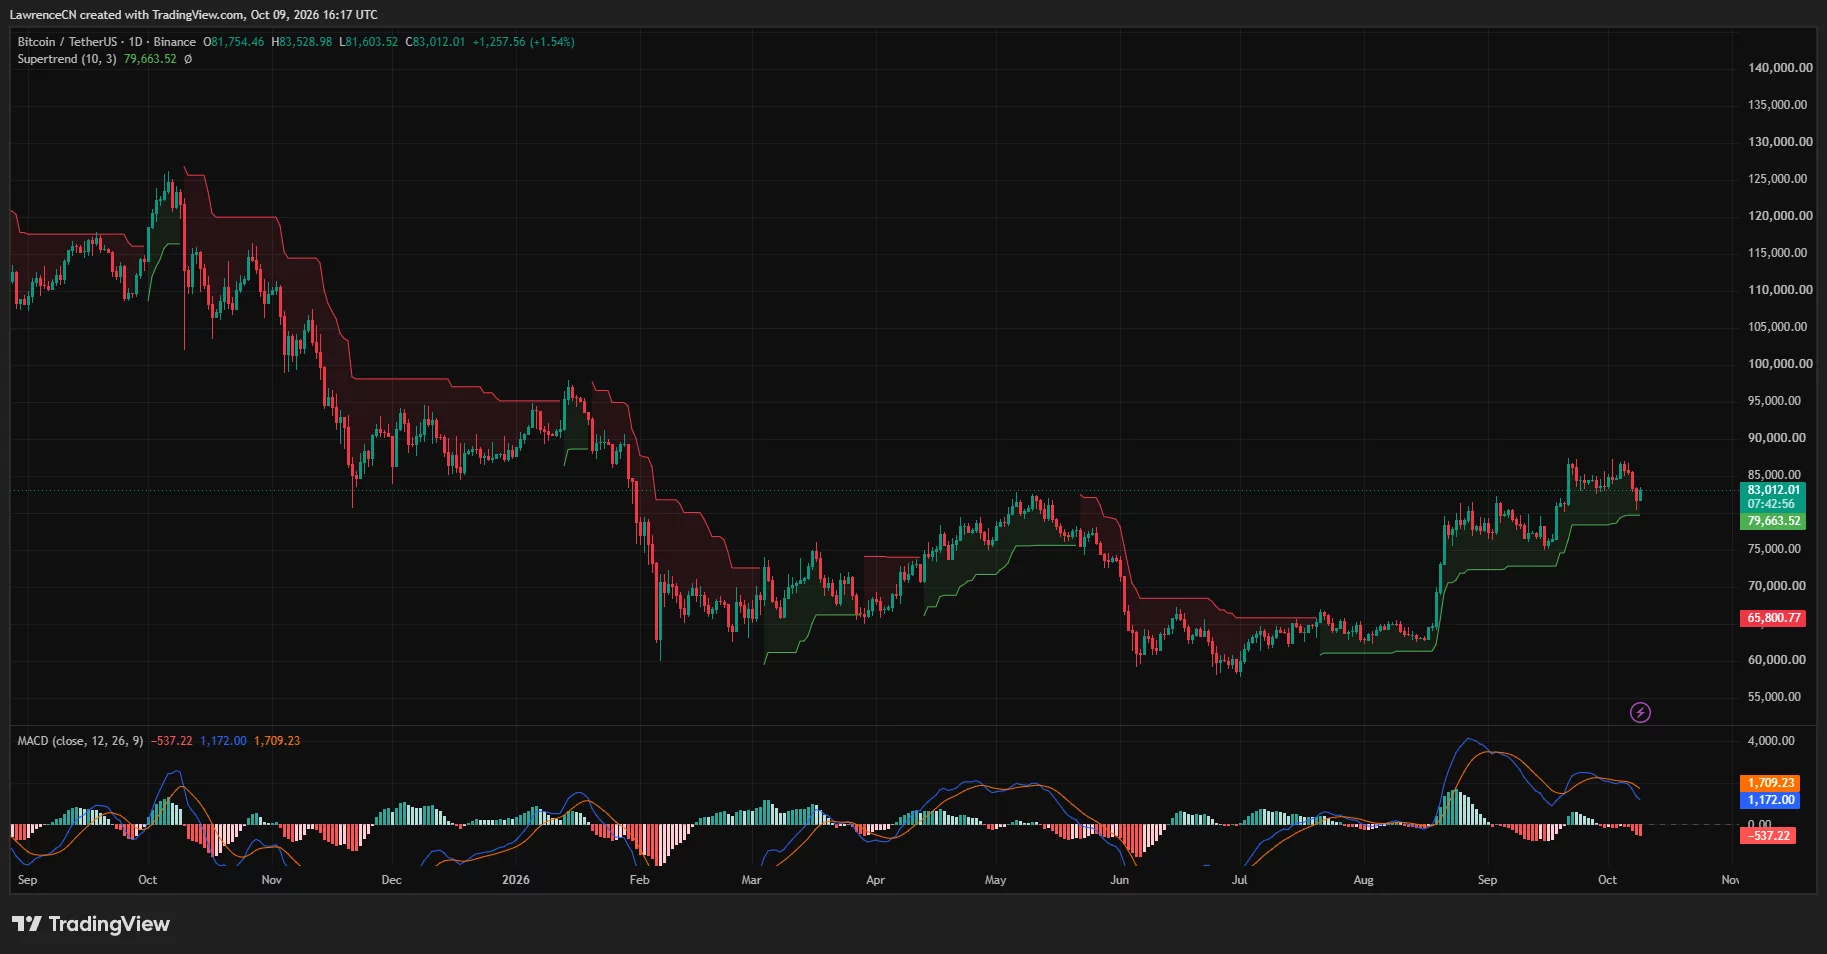
Together, the Supertrend reading and the weekly low identify approximately $79,600–$80,400 as the nearest major support area. A sustained move below that range would weaken the daily recovery structure and expose the earlier trading region around $75,000–$76,000.
The daily MACD offers a more cautious signal. Its blue line stood at 1,172, below the orange signal line at 1,709.23, while the histogram registered negative 537.22.
The bearish crossover indicates that upward momentum has slowed despite Bitcoin’s rebound. Both MACD lines remained above zero, however, distinguishing the current loss of momentum from a fully negative reading across the indicator.
Based on those chart signals, another support test remains possible unless Bitcoin rebuilds momentum above the nearby resistance area. A recovery through $84,000–$85,000 would be an initial improvement, while the recent highs around $86,500–$87,000 represent the more important barrier.
The weekly breakout keeps a recovery scenario alive
Bitcoin’s weekly TradingView chart shows price above the upper boundary of a falling wedge drawn across the decline from its 2025 highs. The breakout occurred before the latest pullback, and the recent candles remain above that descending boundary.
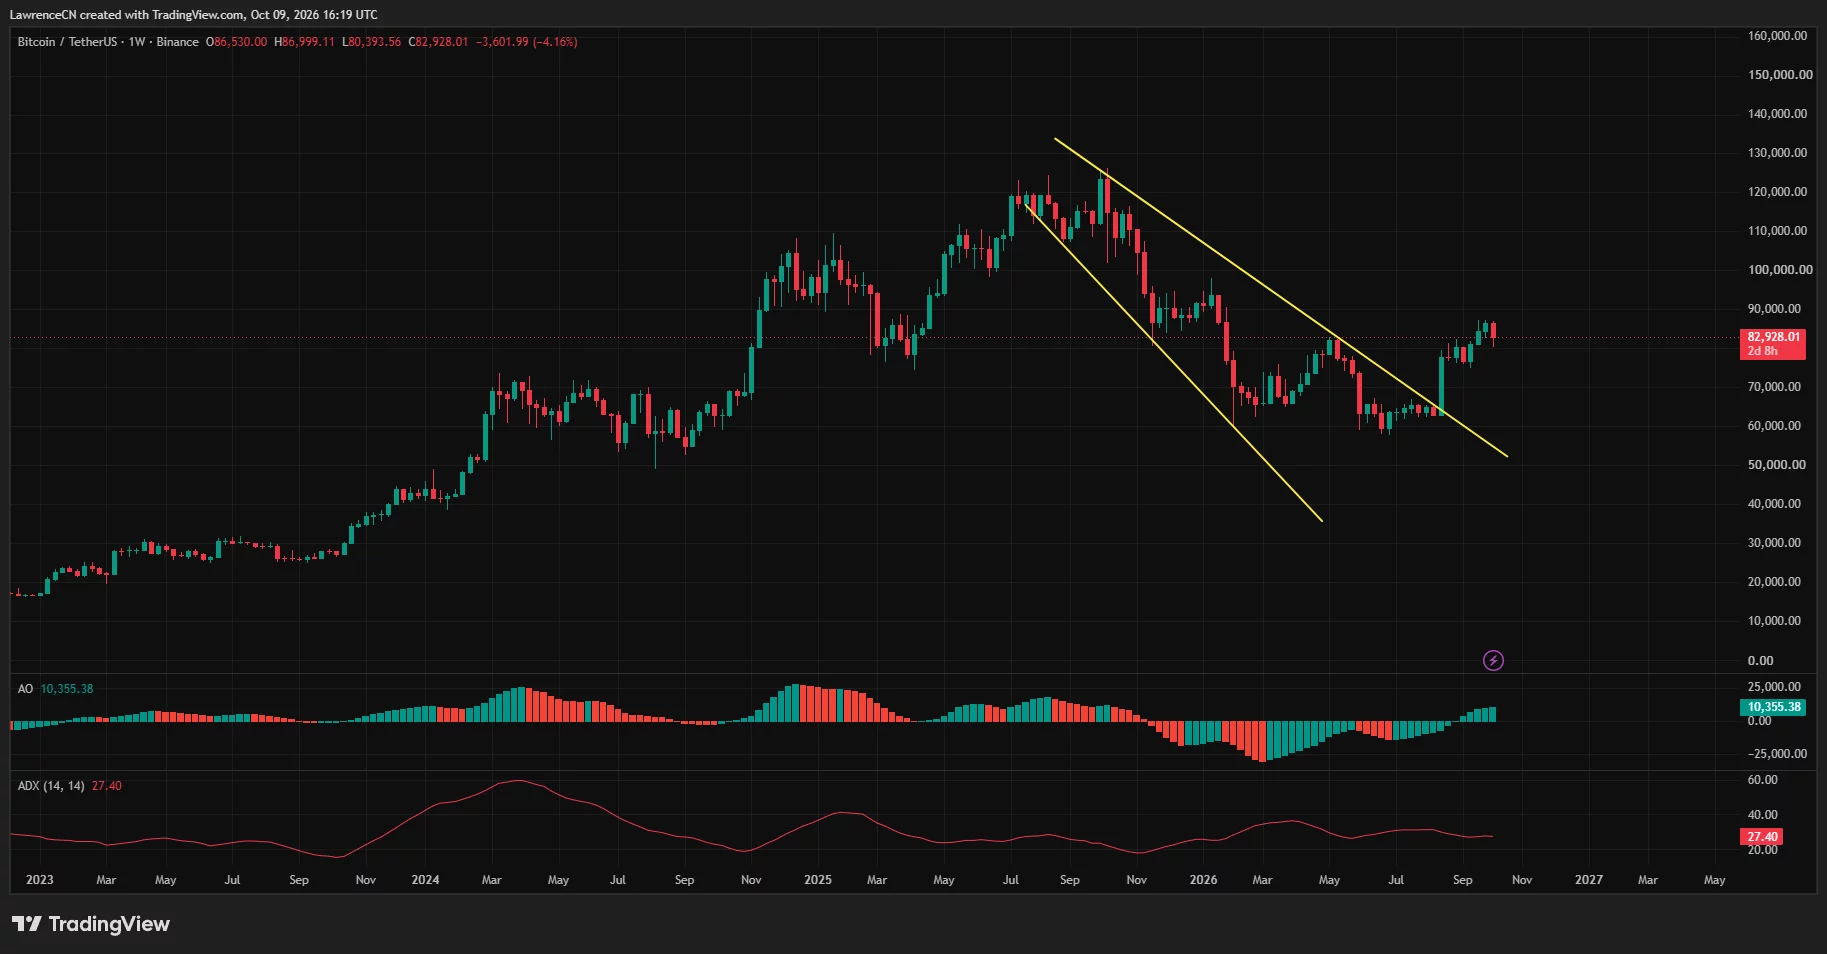
The weekly structure therefore still supports a conditional recovery scenario. The pullback has not yet returned Bitcoin inside the marked wedge, although remaining above the pattern alone does not establish a new upward move.
The weekly Awesome Oscillator stood at positive 10,355.38, with green bars above zero. Its reading contrasts with the bearish daily MACD and suggests that momentum remains stronger on the longer timeframe.
Weekly ADX registered 27.40. The reading indicates an established trend, but ADX measures strength rather than direction and cannot independently confirm that Bitcoin will rise.
Taken together, the weekly breakout and positive oscillator leave room for another attempt at $87,000 if nearby support holds. A sustained break above that recent high would strengthen the chart-based case for a move toward $90,000.
Repeated rejection below $87,000 would leave Bitcoin trading beneath the same ceiling that stopped its early-October advance. Under that scenario, the weekly recovery would need further consolidation before a clearer direction emerges.
Liquidation levels point to $85,000 and $87,000
CoinGlass’s one-week liquidation heatmap shows Bitcoin rebounding after a steep decline toward $80,400. At the right edge of the chart, leveraged positions remain concentrated above the price, including bands around $85,000 and $87,000.
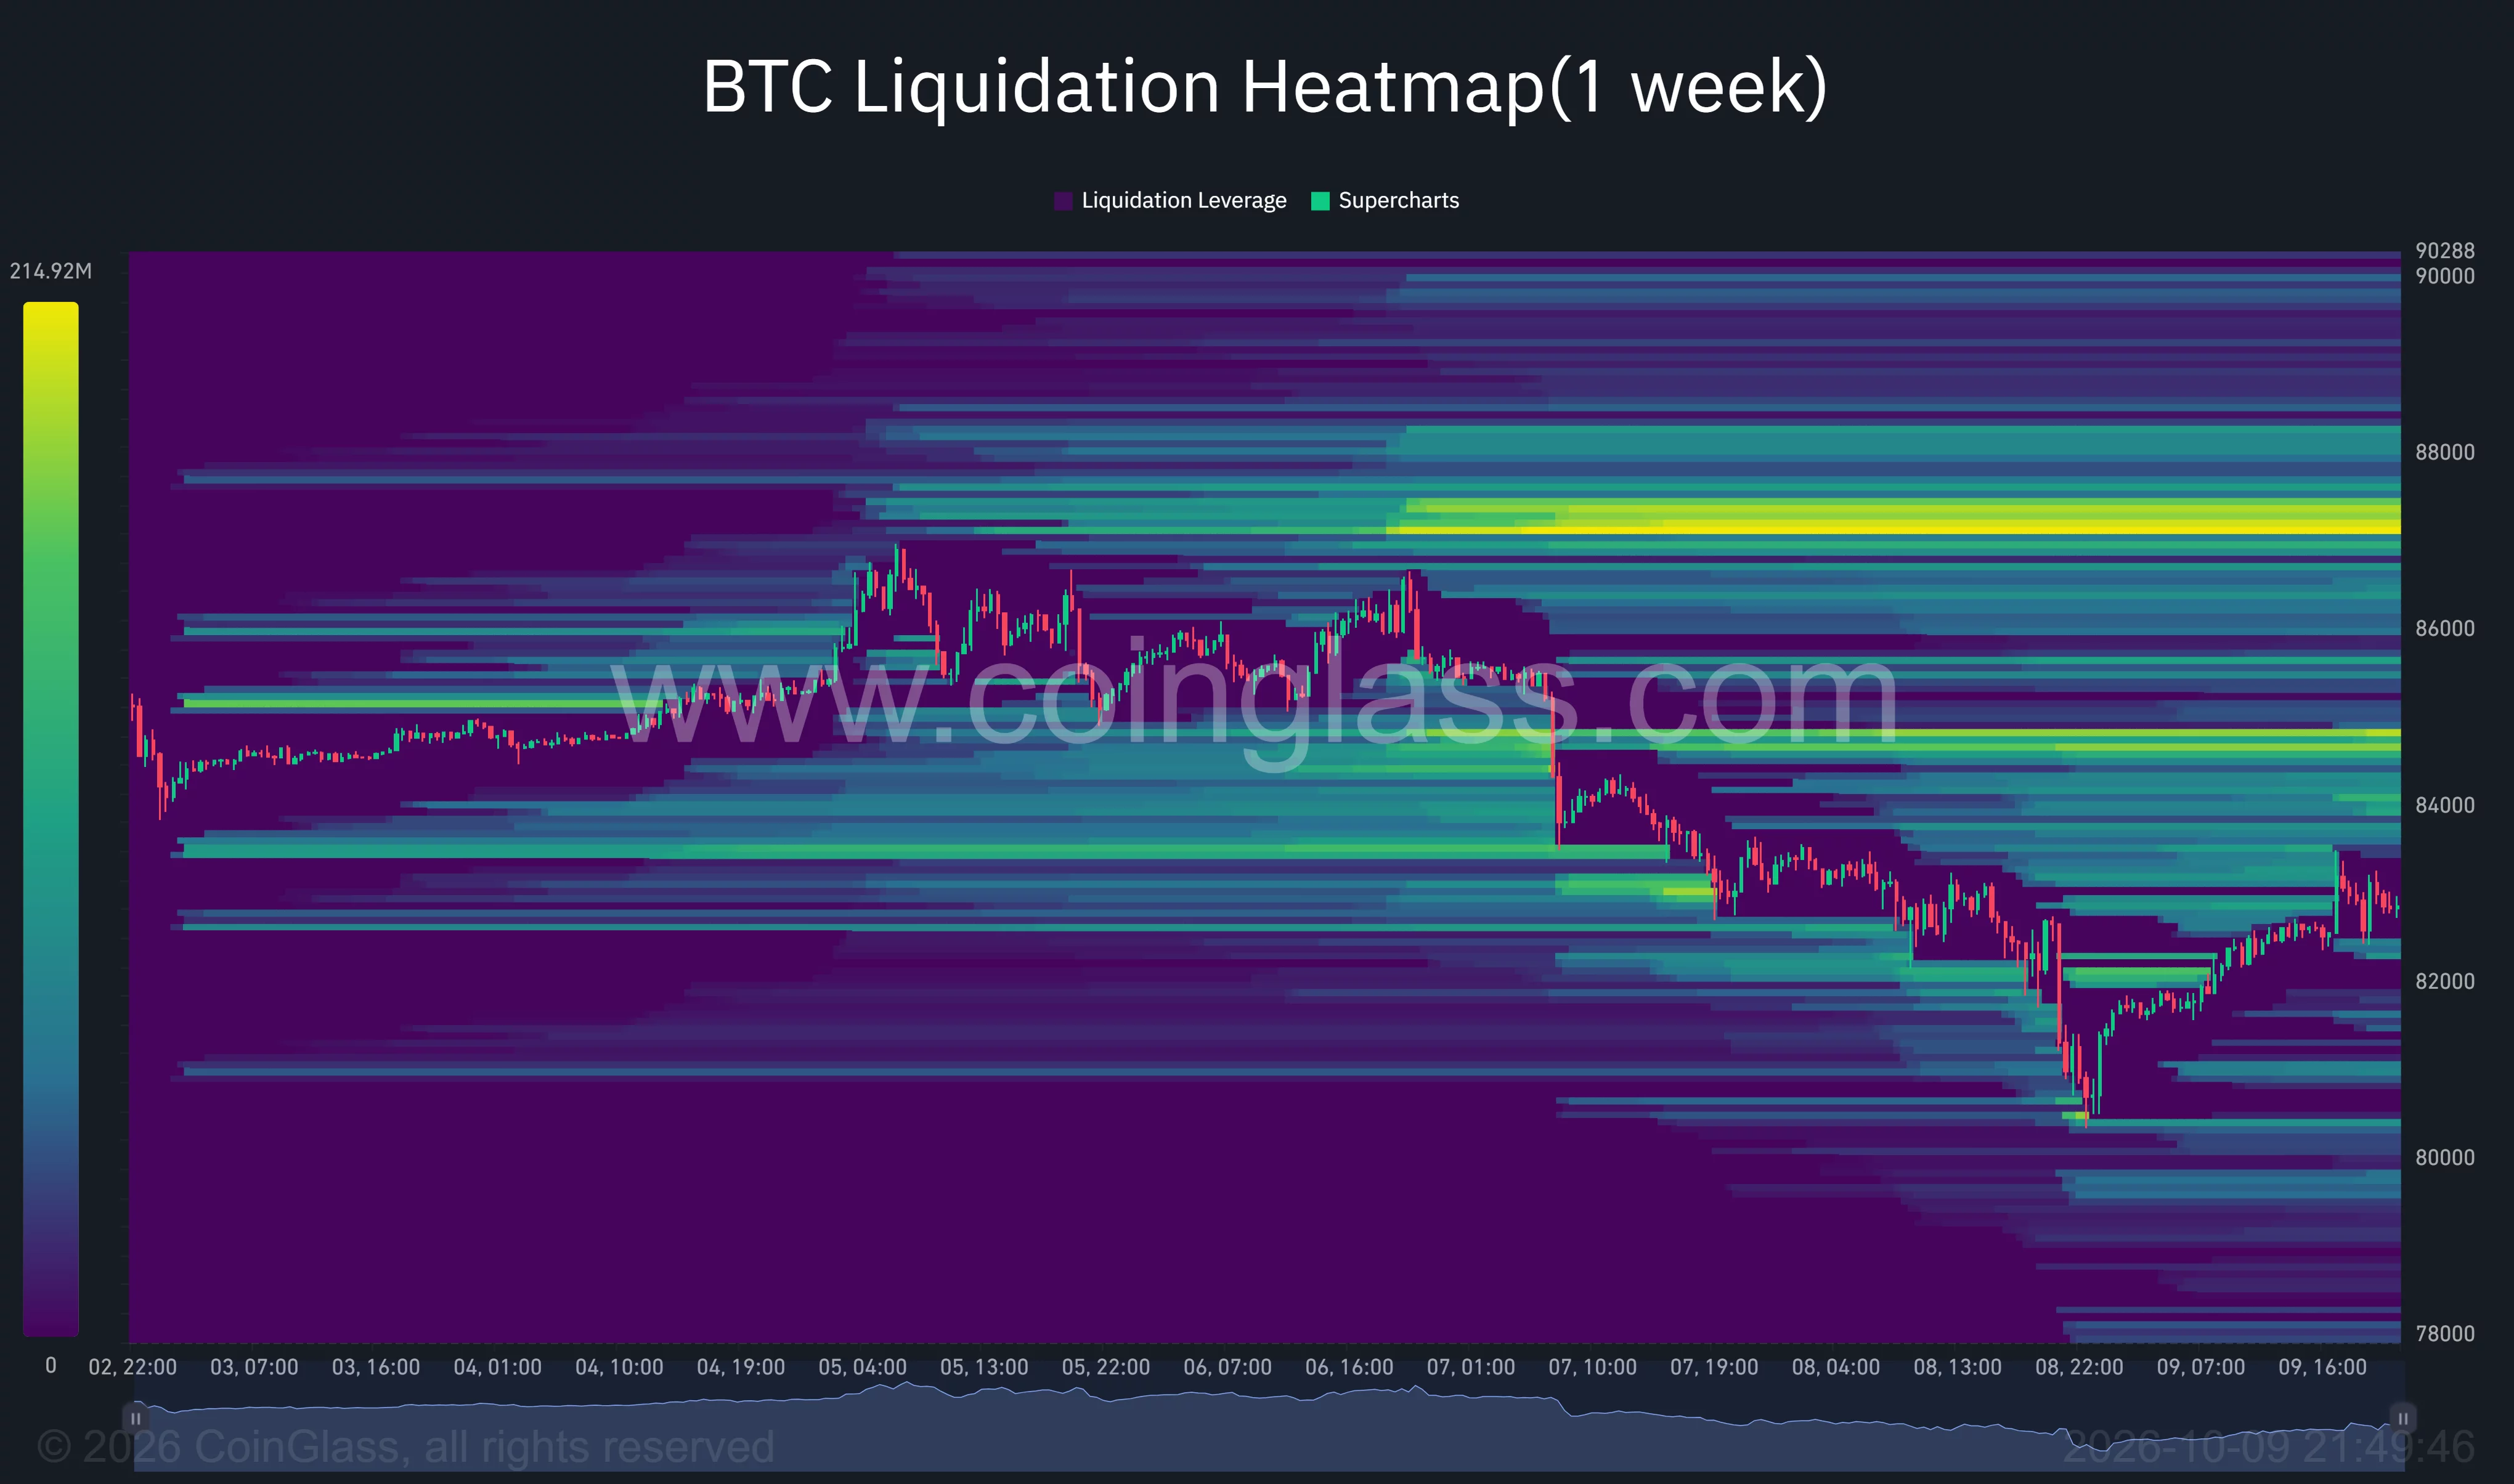
The brightest overhead band sits near $87,000. If Bitcoin advances into that region, closures of vulnerable short positions could amplify the move, although the heatmap cannot establish whether buyers will first drive price there.
Below the market, visible bands remain around $82,000 and $80,400. The positioning leaves room for volatility in either direction, particularly if Bitcoin loses the levels recovered during its latest bounce.
An Oct. 9 commentary post accompanying a CryptoQuant chart reported approximately 55,600 BTC moving to exchanges at a loss over 24 hours. The post interpreted the transfers as pressure on newer holders while acknowledging that exchange deposits do not necessarily represent completed sales.
55,600 $BTC moved to exchanges at a loss in the last 24 hours, alongside $1.09B in crypto liquidations.$BTC briefly fell to $80,350, with longs accounting for ~$1.05B of the wipeout.
— Rain (@raintures) October 9, 2026
Honestly, I find the short-term holder behavior more revealing than the price action itself.… pic.twitter.com/9fFbT4Hgqb
The same commentary cited $1.09 billion in crypto liquidations, including approximately $1.05 billion in long positions. Those figures describe the reported market-wide event, rather than Bitcoin liquidations alone.
The exchange-transfer data adds a potential supply concern to the technical picture. It does not establish how much Bitcoin was sold or whether the holders behind those deposits will continue selling.
US policy remains an October catalyst
Government-linked wallet movements have added another supply concern. crypto.news reported approximately 833.6 BTC worth $71.56 million moving toward Coinbase Prime, with around 264.9 BTC tied to the Bitfinex case and 568.7 BTC linked to the Potapenko and Turogin forfeiture. The transfer raised sale questions rather than confirming a completed disposal.
The Federal Reserve’s September meeting minutes recorded a quarter-point increase to a 3.75%–4% policy range and scheduled the next meeting for Oct. 27–28. The minutes also described higher Treasury yields and oil-driven inflation pressures.
Reuters reported that most officials considered another increase appropriate by year-end, while investors expected an October pause and a December hike. An October increase therefore remains a risk rather than an established outcome.
For the remaining weeks of October, the chart-based outlook hinges on two zones: support around $79,600–$80,400 and resistance around $86,500–$87,000. Holding support and clearing resistance would strengthen the recovery case toward $90,000; losing support would shift attention toward $75,000–$76,000.