Bitcoin just topped a key long-term moving average. Here's what it might mean
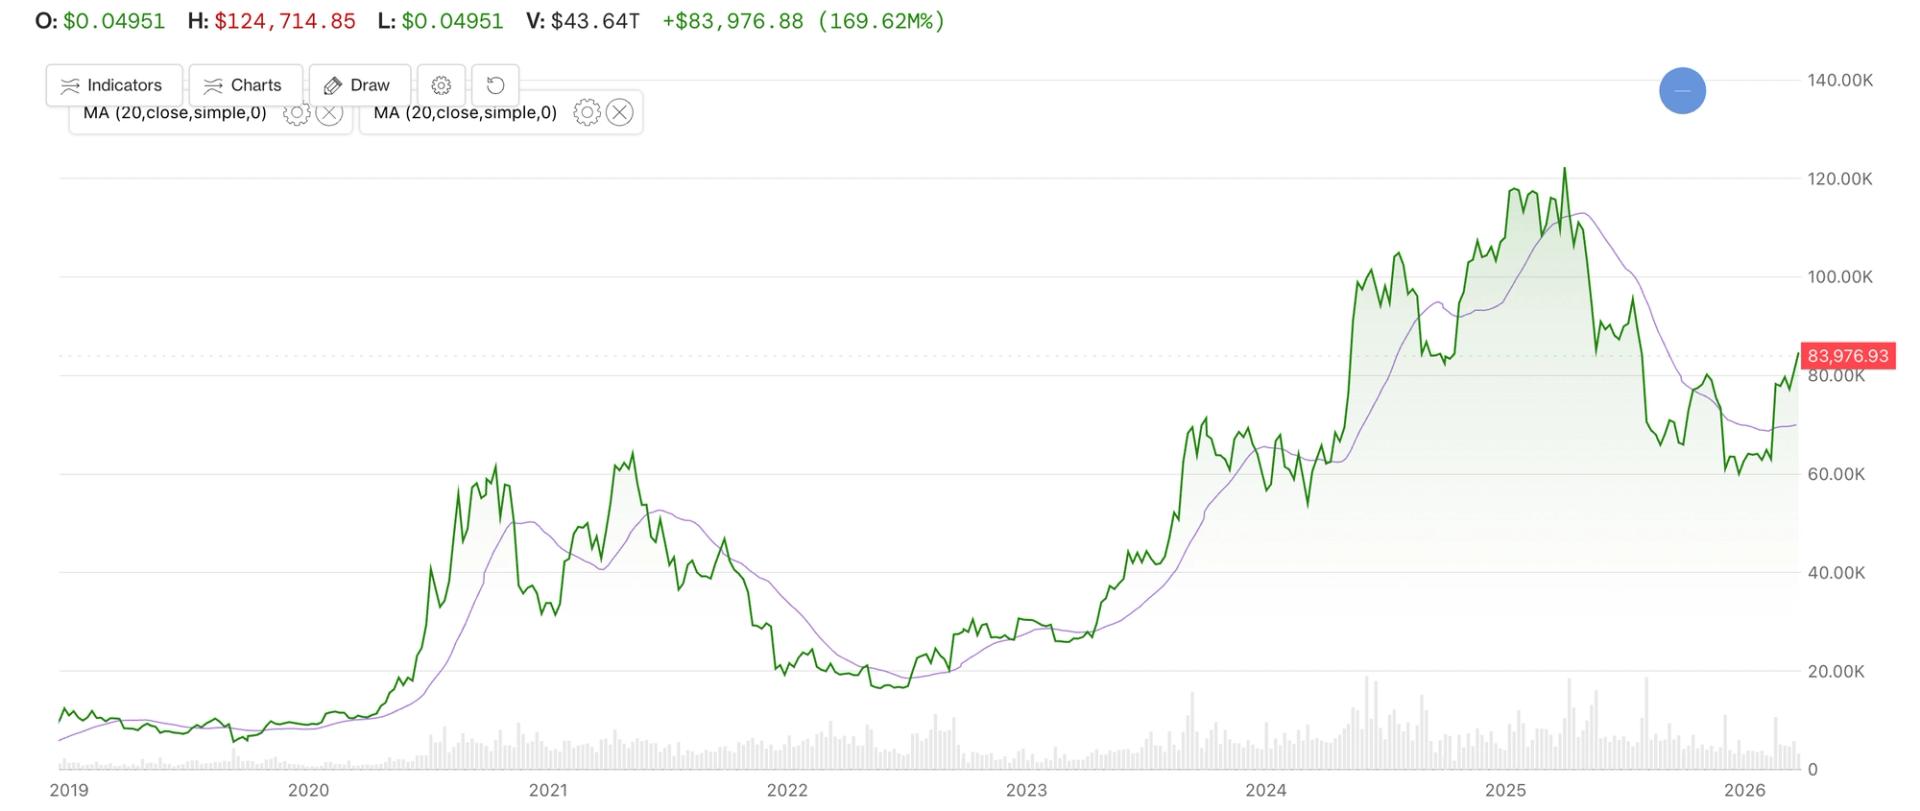
The two remain bullish on bitcoin over the longer term. However, their view depends more on prices trading above the 200-day average than the 365-day average.
“The 365-day is still catching up to something the 200-day already told us in mid-August,” they said. The 200-day average had risen to about $70,800 in AltcoinPro’s calculations, with bitcoin roughly 19% above it before the modest dip of the past 36 hours. The 365-day average, by contrast, was still falling and sat much closer to the market price.
Moving averages are based on past prices, so they show how an asset has traded over a set period rather than where it will go next. A 365-day average responds more slowly to recent changes than a 200-day average.
“The 365-day average is telling you where bitcoin was six months ago,” Ryan and Joni Zhuleku said. “The 200-day reaction is roughly three months earlier. In a market that moves the way this one does, three months is the whole trade.”
Bitcoin’s 50-day average crossed above its 200-day average on Sept. 8, creating the so-called golden cross. This signal has a mixed record as a standalone predictor, with several past crosses failing to produce a sustained rally, CoinDesk’s Omkar Godbole wrote.