Aptos price slips below $0.80 as momentum fades: Can APT hold support?

Aptos price has slipped below $0.80 following its recent rally, with weakening daily momentum and a bearish weekly trend putting the $0.76–$0.78 support area in focus after its investor vesting cycle ended.
- APT traded near $0.795 on Oct. 14, with its daily candle showing a 4.99% decline.
- Daily MACD recorded a bearish crossover, while Chaikin Money Flow slipped below zero.
- Weekly Supertrend remained bearish at $0.9652, above the token’s current trading price.
- Scheduled monthly releases fell to approximately 4.54 million APT after investor and contributor vesting ended.
TradingView’s Binance APT/USDT daily chart showed Aptos trading at $0.7951 on Oct. 14, down from a daily opening price of $0.8368. The token reached an intraday high of $0.8496 before falling to $0.7867.
The weekly chart also showed a retreat, with APT down 11.77% from its weekly opening price of $0.9012. Its weekly range extended from $0.7613 to $0.9155, placing the token closer to the lower end of that range.
The daily chart showed APT recovering from the roughly $0.50–$0.60 region during September before moving above $0.80. October’s pullback has taken the token back below that level, while recent highs remain around $0.90–$0.92.
Aptos unlock reduction leaves continuing monthly releases
Aptos Foundation’s February tokenomics update said the four-year unlock cycle for initial investors and core contributors would conclude in October 2026, reducing annualized scheduled unlocks by approximately 60%.
Staking provider Everstake’s schedule review placed the final release for those two groups on Sept. 12, with the vesting period formally ending on Oct. 12. Their combined monthly allocation previously accounted for about 6.77 million APT.
With those allocations completed, scheduled monthly releases decline from approximately 11.31 million to 4.54 million APT. The remaining releases come from the community and Foundation pools.
The reduction concerns the release of previously allocated tokens. Staking rewards remain a separate source of new APT, while tokens already unlocked remain available to their holders.
APT’s price retreat coincided with the formal end of the vesting period, but neither the unlock schedule nor the price charts establish that recipients sold tokens during the decline.
Daily MACD turns bearish as money flow weakens
TradingView’s daily chart showed the moving average convergence divergence line at 0.0303, below its signal line at 0.0369. The resulting histogram reading was negative at −0.0066.
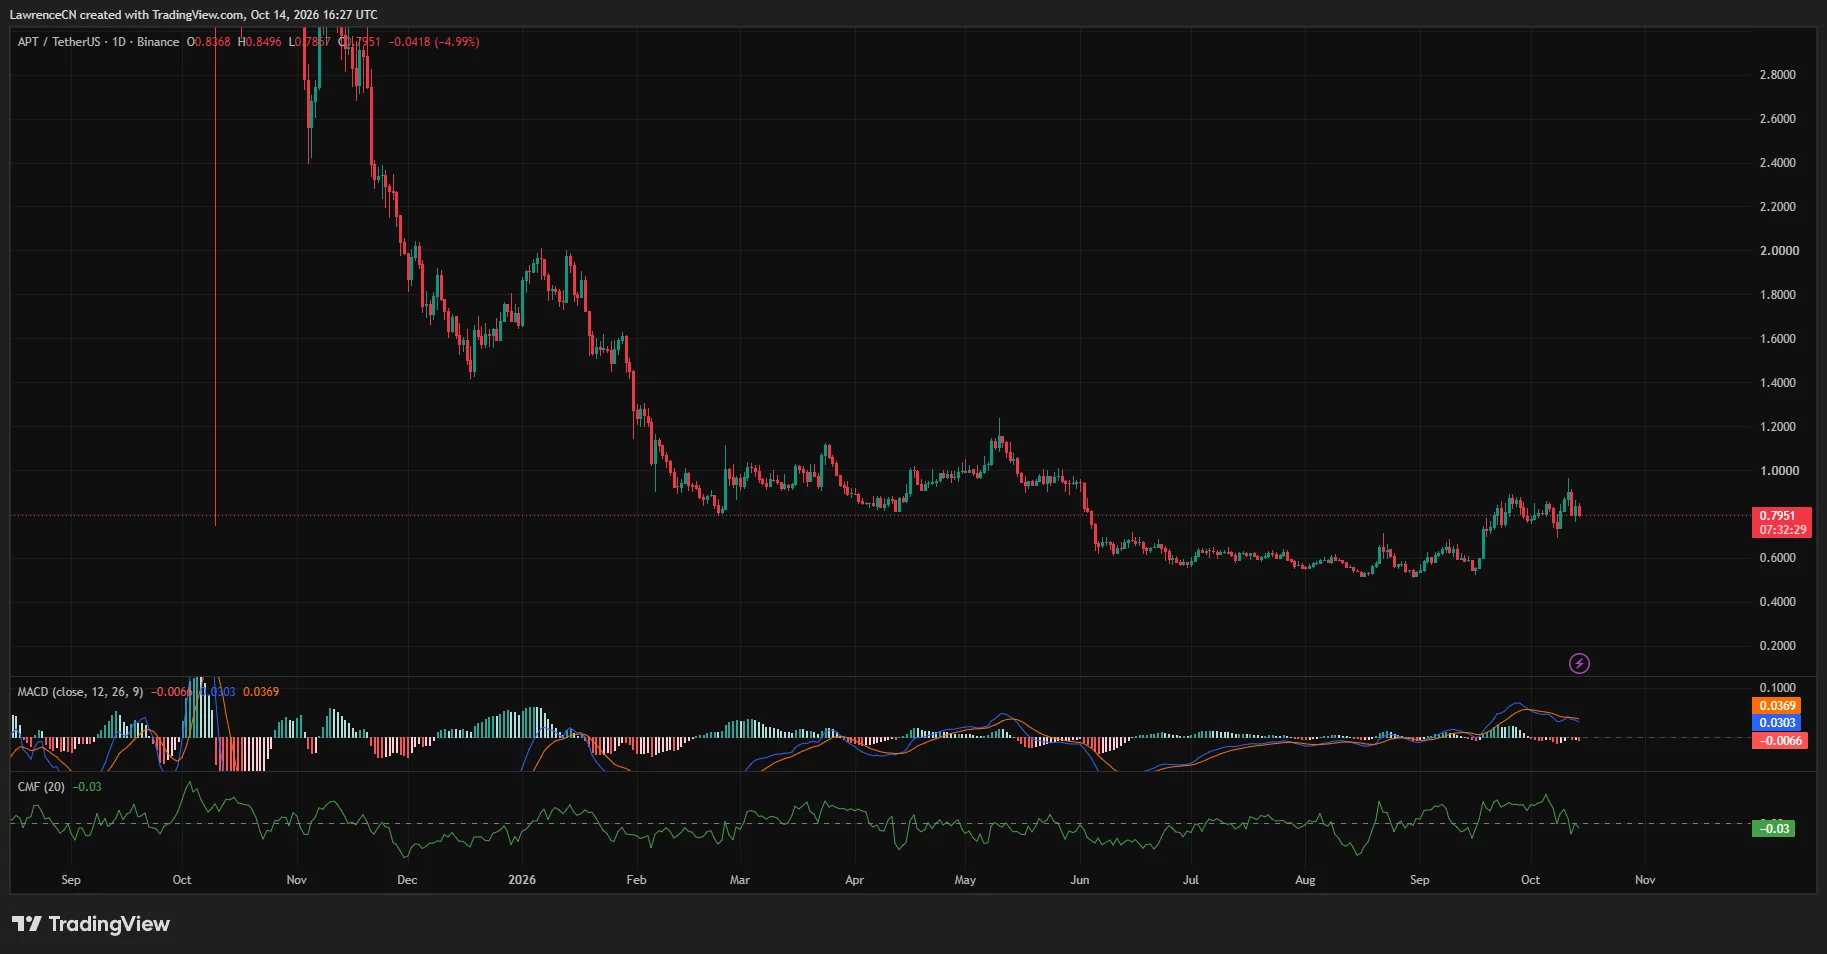
Both lines remained above zero, preserving part of the momentum built during the September recovery. However, the MACD line’s move below the signal line formed a bearish crossover, while recent histogram bars turned red.
The daily Chaikin Money Flow reading also fell to −0.03. The volume-weighted indicator moved below its zero line after spending much of the recent recovery in positive territory.
Together, the two indicators showed weaker momentum and money flow as APT lost $0.80. The daily chart still placed the token above its August and early-September lows, but below October’s recent peaks.
On the price chart, the $0.84–$0.85 region contains the latest daily high and several recent trading swings. Above that area, October’s highs around $0.90–$0.92 form the next visible resistance zone.
Below the current price, the daily low near $0.787 and weekly low near $0.761 define the closest observed support references. Earlier trading activity sits farther down around $0.70 and $0.60.
Weekly Supertrend remains above Aptos price
TradingView’s weekly Supertrend stood at $0.9652 and remained red, leaving APT below the indicator’s trend boundary despite its rebound from September’s lows.
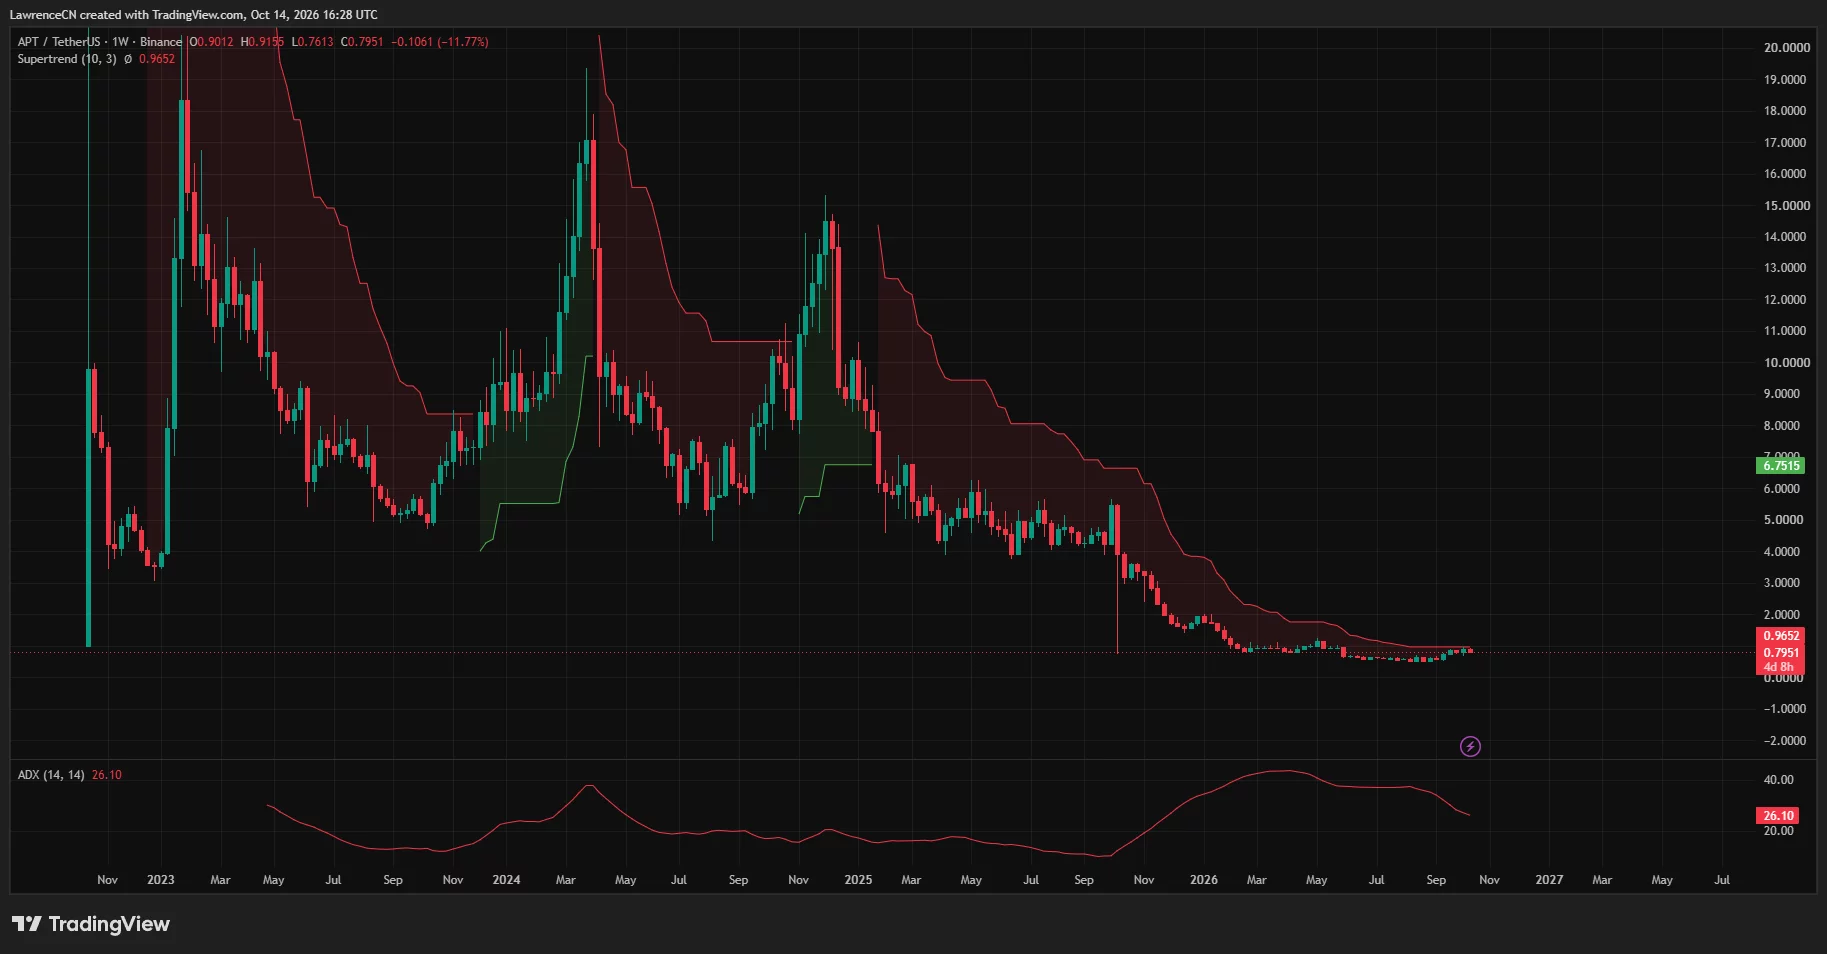
The weekly chart showed a broader sequence of falling highs extending through 2025 and 2026. The recent recovery remained near the bottom of that longer price history, well below previous trading ranges above $1.
The weekly average directional index measured 26.10 and was declining from earlier readings above 40. ADX measures trend strength rather than direction; the falling reading showed that the established trend had weakened, while Supertrend continued to display a bearish signal.
A recovery toward $0.90 would therefore leave APT below the weekly Supertrend. The indicator’s $0.9652 reading sits close to the $1 level discussed in bullish market commentary.
An analyst publishing as Phoenix described an upward structure from August’s lows in an Oct. 14 post and projected consolidation above the 200-period moving average. The analyst also claimed large holders were accumulating and identified $1 as an upside objective.
That outlook contrasts with the latest daily price decline and negative money-flow reading. Phoenix’s accumulation claim remains the analyst’s interpretation, rather than a holder-flow figure shown by the daily or weekly charts.
Liquidation clusters build above the current price
CoinGlass’s three-day liquidation heatmap showed APT falling from above $0.92 toward $0.79 between late Oct. 11 and Oct. 14, interrupted by rebounds around $0.86 and $0.85.
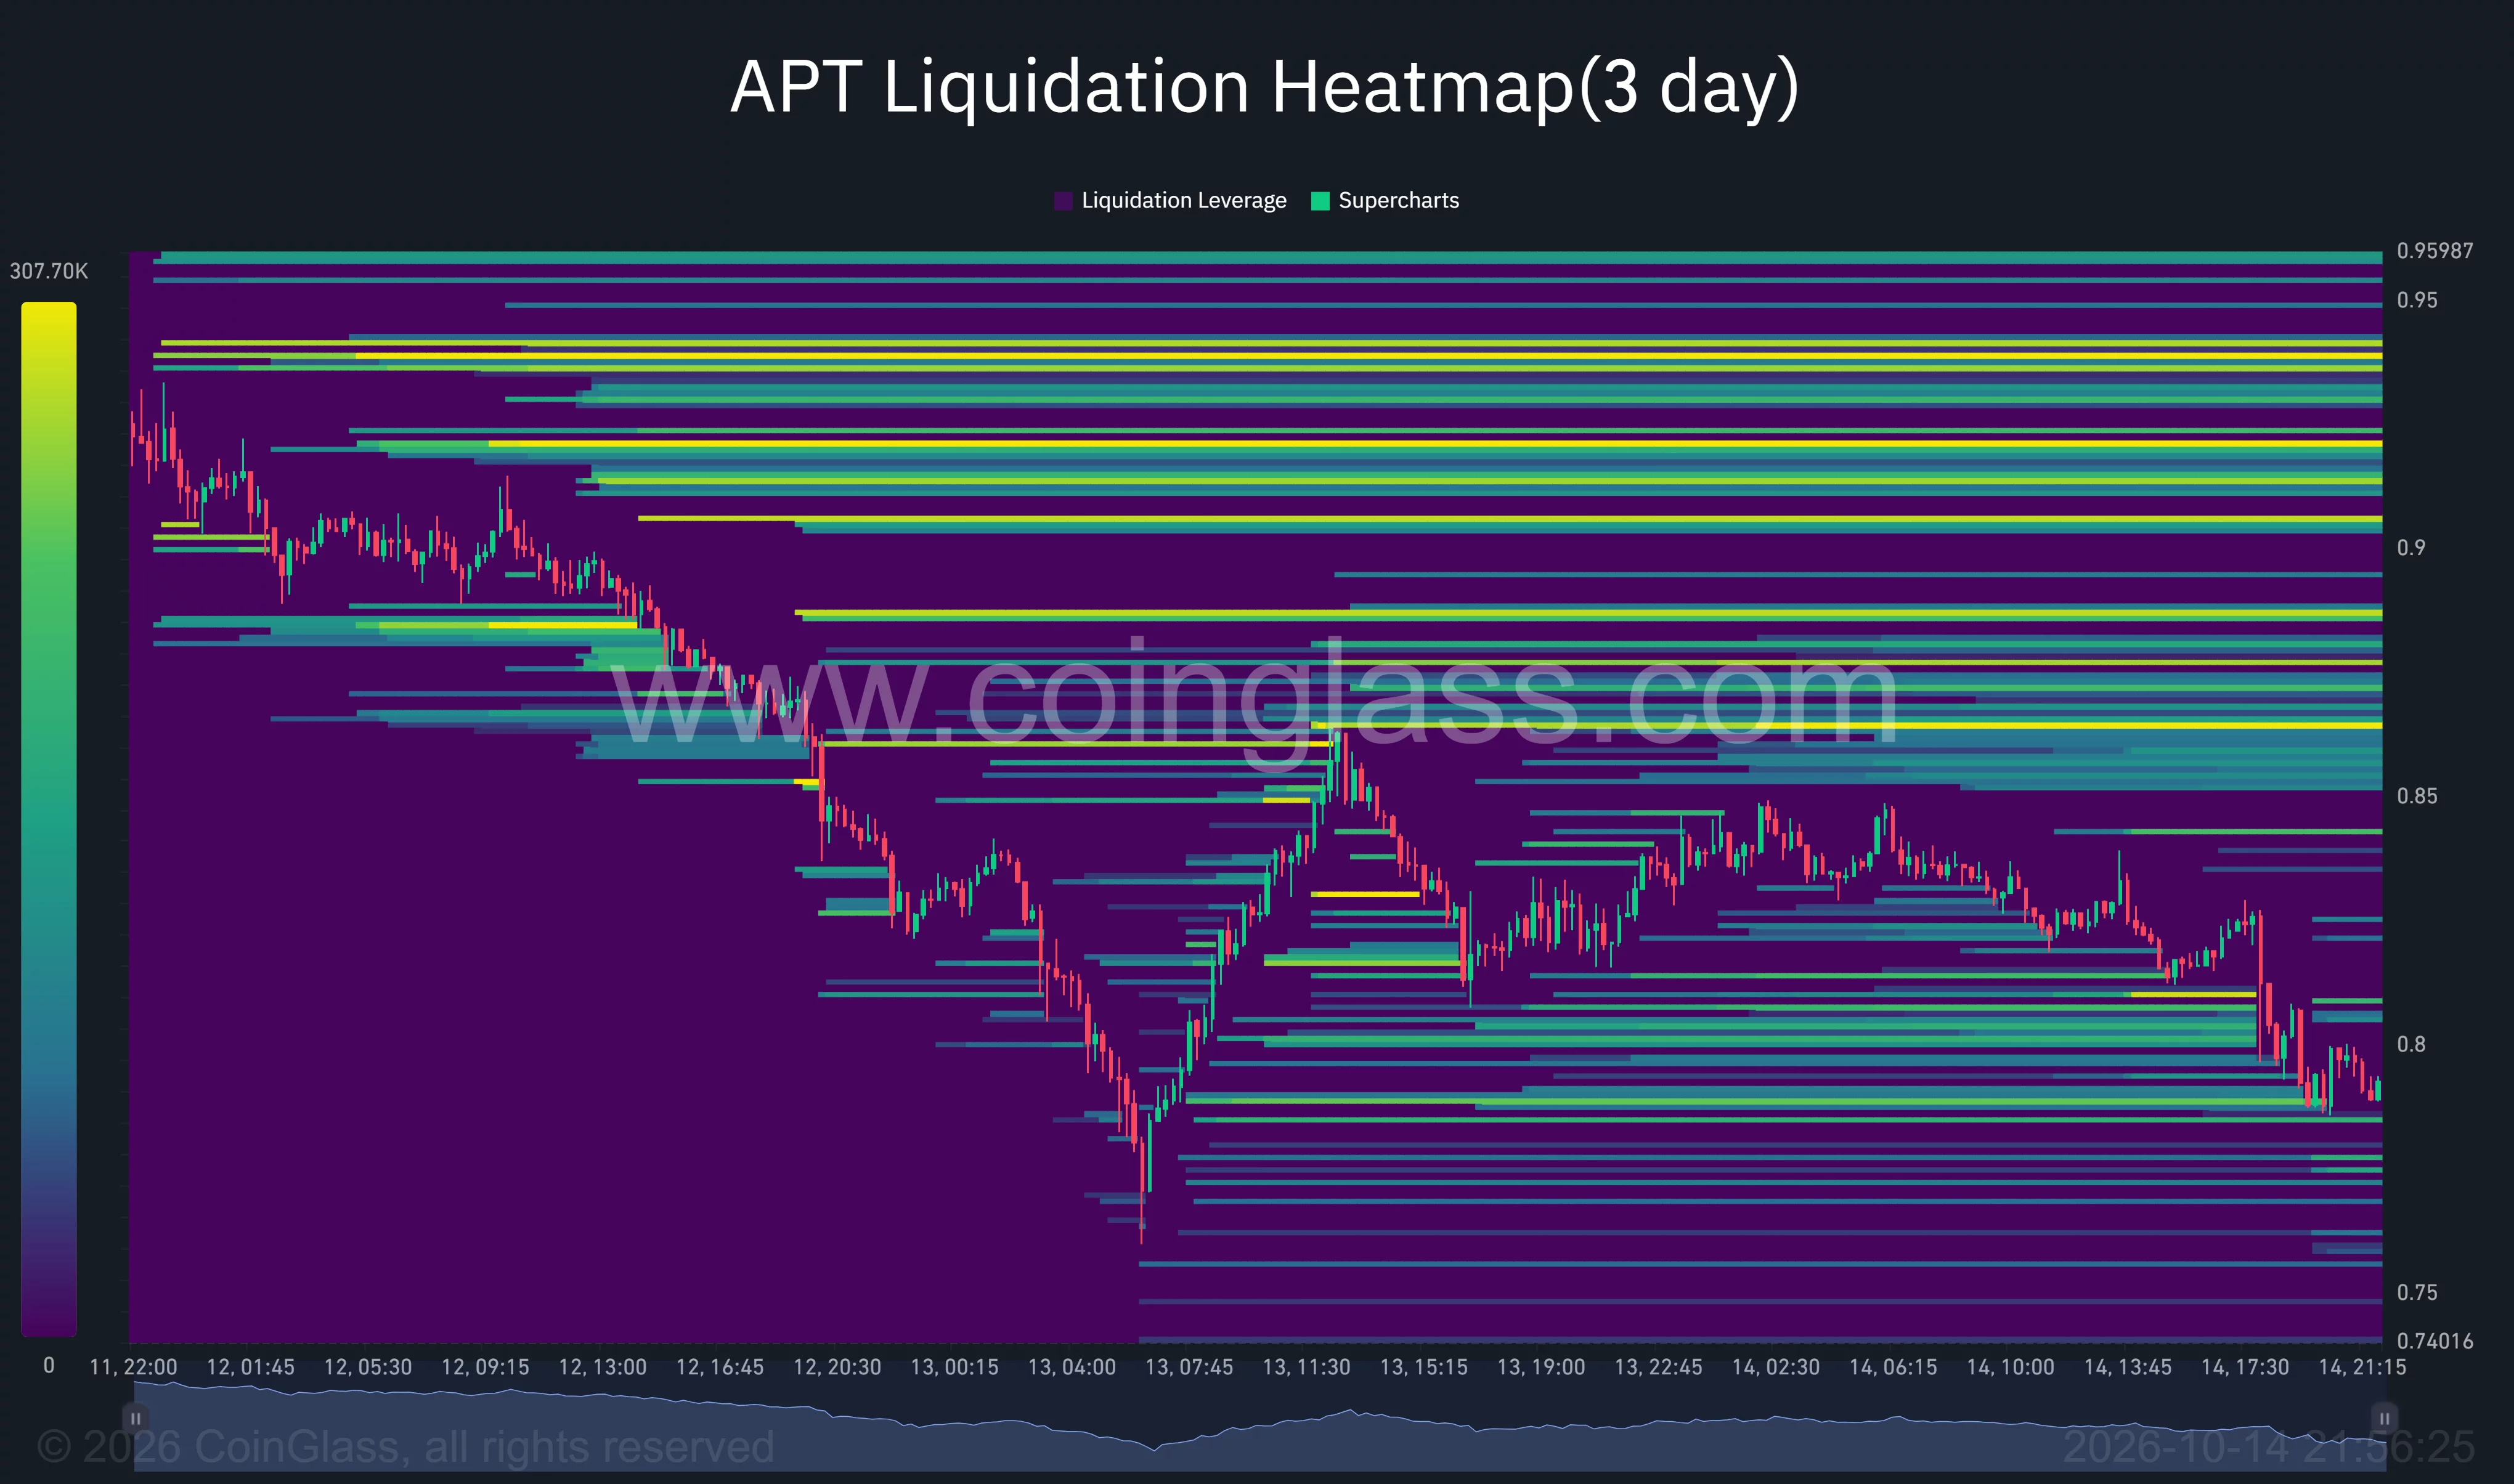
At the right edge of the heatmap, nearby estimated liquidation bands appeared around $0.80–$0.81. Larger overhead concentrations were visible near $0.86–$0.89, followed by brighter bands around $0.91–$0.94.
Below the price, estimated liquidation concentrations appeared near $0.785, with additional bands around $0.77–$0.78. Those levels overlap the lower portion of the token’s weekly trading range.
Alongside the supply change, Aptos announced an optional transaction-encryption feature on mainnet on Oct. 12. The Foundation said Petra supports the feature and Decibel plans to use it to protect pending orders.
The network’s broader institutional connection includes U.S. asset managers BlackRock, Franklin Templeton and Apollo, which Aptos identified in its ecosystem update. Its May announcement also outlined more than $50 million in commitments across products, research, infrastructure, trading and AI partners.
For the immediate price setup, TradingView’s charts place APT between support near $0.76–$0.78 and resistance around $0.84–$0.85, with the weekly Supertrend farther overhead at $0.9652.